
Figures & data
Table 1. Excerpt of previous works for DRL in traffic signal optimisation and their system design decisions with regard to the issues mentioned above.
Figure 1. Simplified scheme of the time gap control.
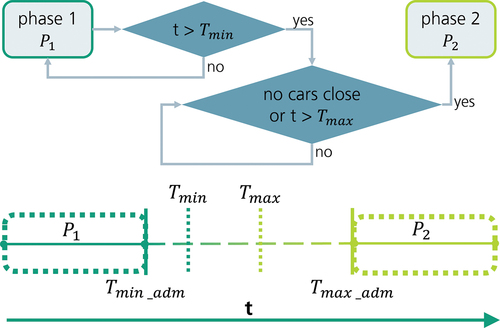
Figure 2. Full concept for the RL training based on real-world data and transfer to the real-world application based on DRIVERS.
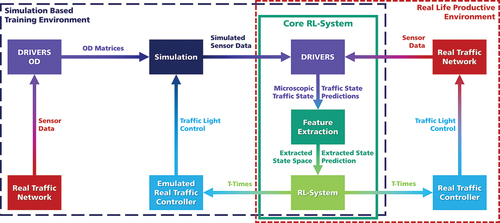
Figure 3. Traffic network of Ingolstadt together with the corresponding microscopic traffic simulation and estimation representation by DRIVERS.
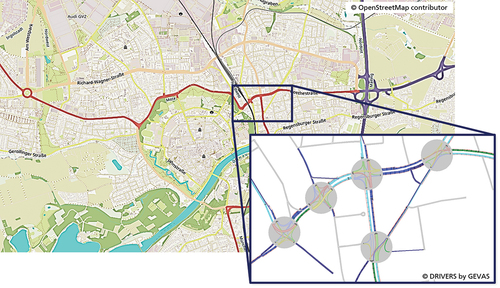
Table 2. Mapping of concept components to the issues discussed in Section 3.
Figure 4. First training scheme for training based on real-world data and real-world compliant control concept.
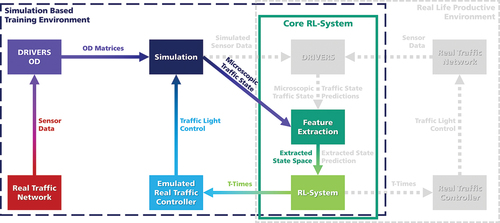
Figure 5. Optimized agent performance at a single crossing. Blue and red lines indicate agent and benchmark rewards, respectively, with corresponding standard deviations shown in shaded areas.
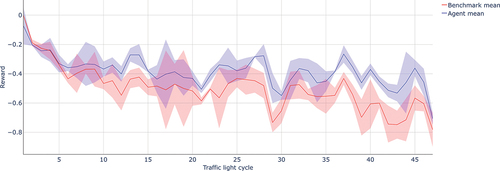
Figure 6. Comparison of mean, median, upper and lower quantiles, standard deviation, and outliers between the benchmark and the agent across all data points. The dotted lines represent the mean, +1 standard deviation, and −1 standard deviation.
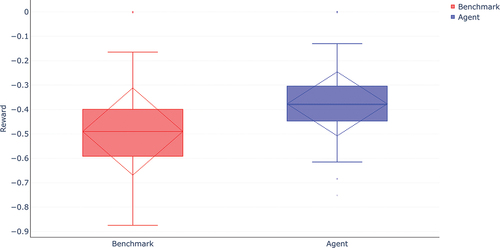
Figure 7. Comparison of agent-based traffic actuated control improvements in percentage relative to real-world traffic actuated control with default T-times. Median improvements are indicated with a solid line, while mean improvements are indicated with a horizontal dotted line. The dotted triangular lines represent +1 standard deviation and −1 standard deviation.
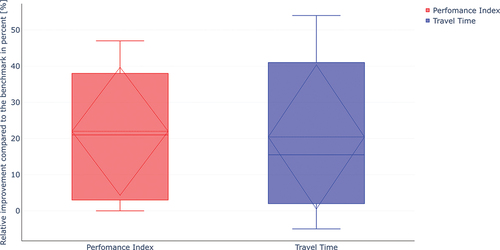
Figure 8. Visual comparison between the benchmark behavior and the agent’s behavior on a simulative example traffic volume.
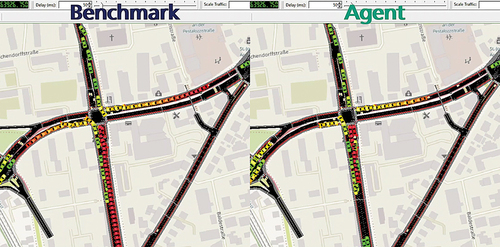
Table 3. Definition of mathematical symbols used in this work.