Figures & data
Figure 1. Production scenario with three machines in stage 1 and one machine in stage 2.
Figure 2. Developed framework for combining simulation and optimization models (Schumacher, Citation2023).
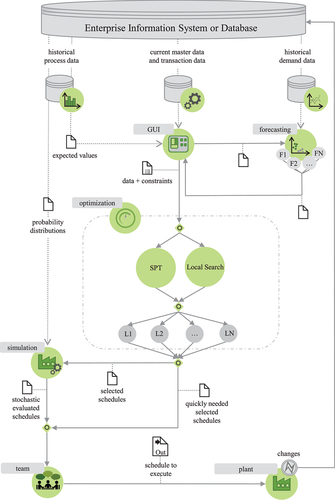
Table 1. Product parameters data concept for optimisation and simulation (Schumacher & Buchholz, Citation2020).
Figure 3. Data processing.
Figure 4. Data modeling.
Figure 5. Fitted distributions on a sample data set of machine scrap rates.
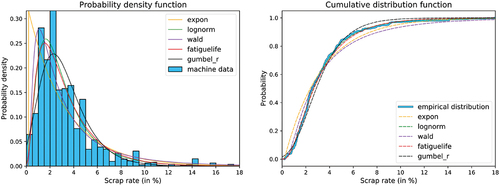
Figure 6. Fitted distributions on a sample data set of human worker scrap rates.
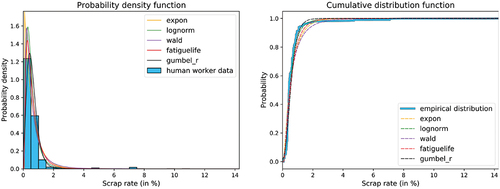
Figure 7. Fitted distributions on a sample data set of machine processing times.
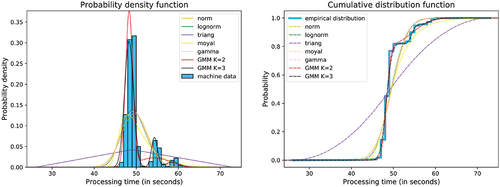
Figure 8. Model fitting process on a sample data set of machine processing times with multiple clusters.
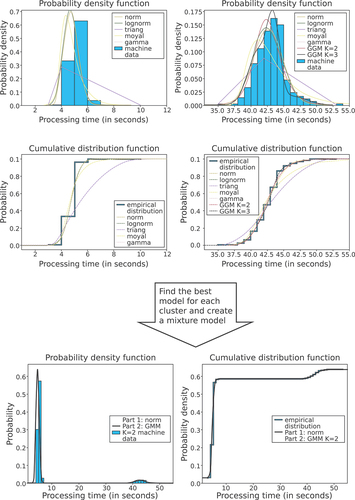
Figure 9. Example PP- and QQ-Plots for machine scrap data.
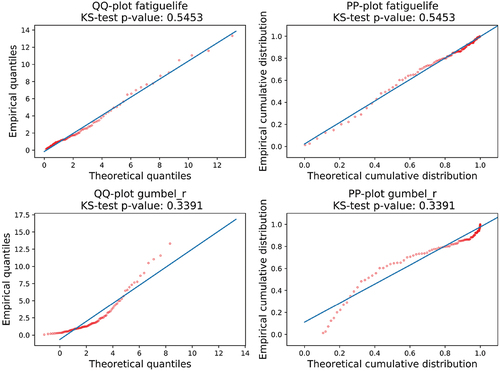
Table 2. Evaluation of KS-test for example scrap rate data sets.
Table 3. Fitted distributions for scrap rates.
Table 4. Evaluation of KS-test for example processing time data sets.
Table 5. Fitted Distributions for Processing Times.
Table 6. Change point detection for varying mean and variance values of the processing times (machine A, article 1).
Figure 10. Histograms of processing times for different change points (Machine A, Article 1).
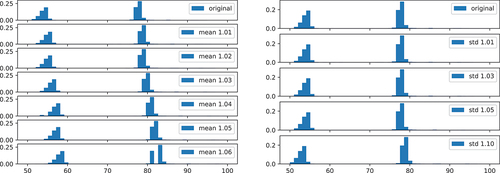
Figure 11. Histograms of Processing Times for different Change Points (Machine B, Article 2).
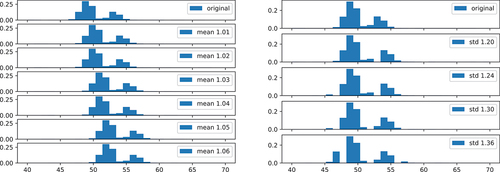
Table 7. Change point detection for varying mean and variance values of the processing times (Machine B, Article 2).
Figure 12. Histograms of Processing Times for different Change Points (Machine C, Article 3).
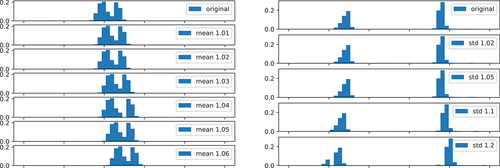
Table 8. Change point detection for varying mean and variance values of the processing times (Machine C, Article 3).
Figure 13. Average log-likelihood for processing times (Machine B, Article 2).
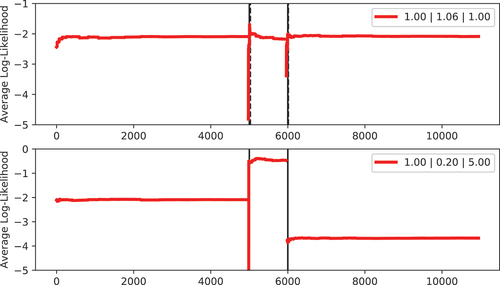
Figure 14. Comparison of average log-likelihood for processing times (Machine A, Article 1) using the EM algorithm for GMMs.
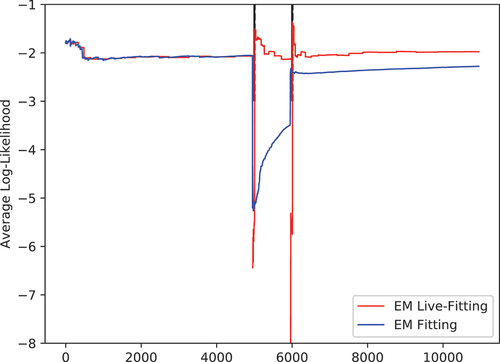
Figure 15. Histograms of scrap rates for different change points (Machine D, Article 4).
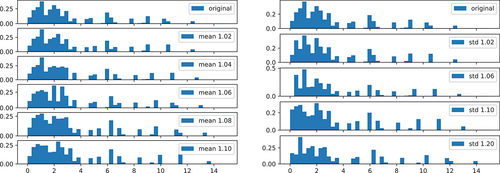
Figure 16. Histograms of scrap rates for different change points (Machine E, Article 5).
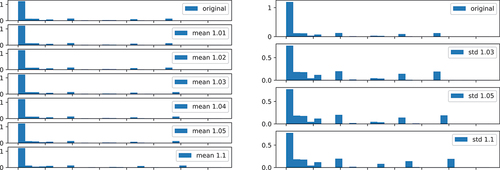
Table 9. Change point detection for varying mean and variance values of the scrap rates (Machine D, Article 4).
Table 10. Change point detection for varying mean and variance values of the scrap rates (Machine E, Article 5).
Figure 17. Average log-likelihood for scrap rates (Machine D, Article 4).
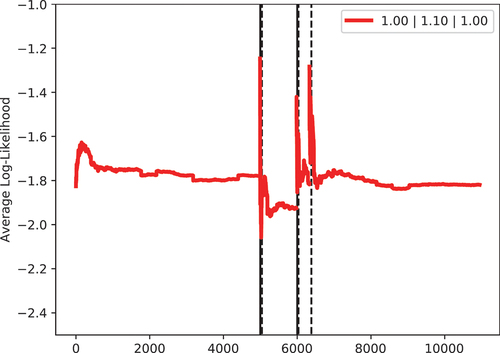
Figure 18. Modified schedule due to change point detection.