Figures & data
Table 1. Labour productivity by region.
Table 2. Labour productivity by economic activity in the Canterbury region.
Table 3. Labour productivity by economic activity in Christchurch City.
Table 4. Labour productivity by economic activity in the rest of Canterbury (excluding Christchurch City).
Table 5. Labour productivity by economic activity in the Waikato region.
Figure 1. Percentage change in production -based real gross domestic product (GDP) in New Zealand. Source: Reserve Bank of New Zealand. https://www.rbnz.govt.nz/statistics/series/economic-indicators/gross-domestic-product.
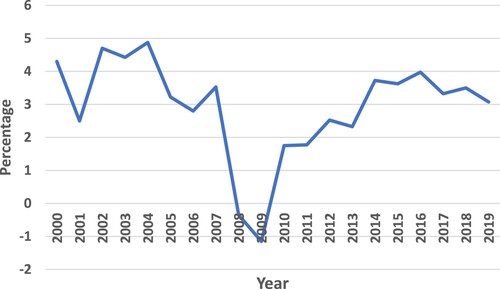
Figure 2. Average labour productivity for Canterbury and Waikato.
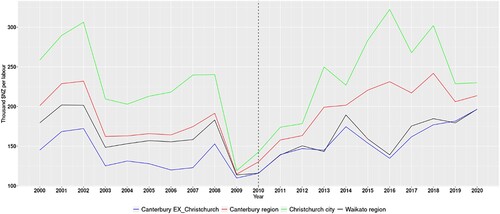
Table 6. t-Test for parallel trend.
Figure 3. Dynamic effect of the Christchurch earthquakes on labour productivity in Canterbury region, Christchurch city, and Canterbury region excluding Christchurch city.
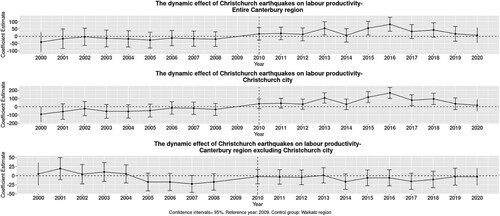
Figure 4. Average labour productivity by economic activity.
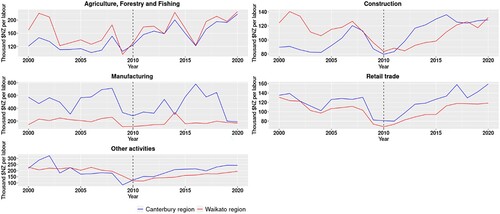
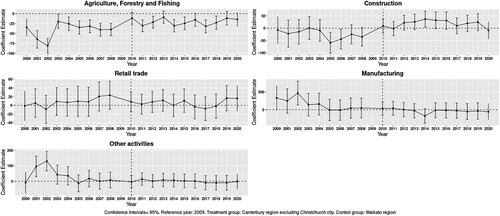
Figure 5. Dynamic effect of the Christchurch earthquakes on labour productivity according to the economic sectors in the Canterbury region.
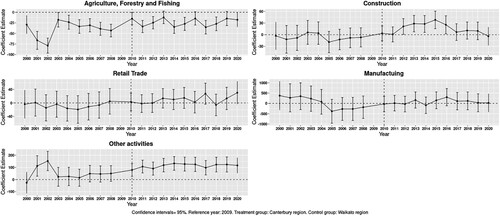
Figure 6. Dynamic effect of the Christchurch earthquakes on labour productivity according to the economic sectors in the Christchurch city.
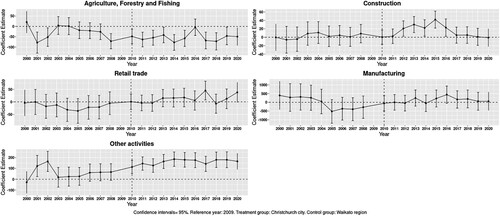
Figure 7. Dynamic effect of the Christchurch earthquakes on labour productivity according to the economic sectors in the Canterbury region excluding Christchurch city.