
Figures & data
Figure 1. Frequency-fatality plots (cumulative) for (A) hydrological, (B) meteorological and (C) eophysical disasters in the EM-DAT database, for sequential periods. Cumulative event frequency on the y-axis refers to the cumulative number of disasters with fatalities equal to or exceeding a given number of fatalities reported for each individual disaster (
, x-axis).
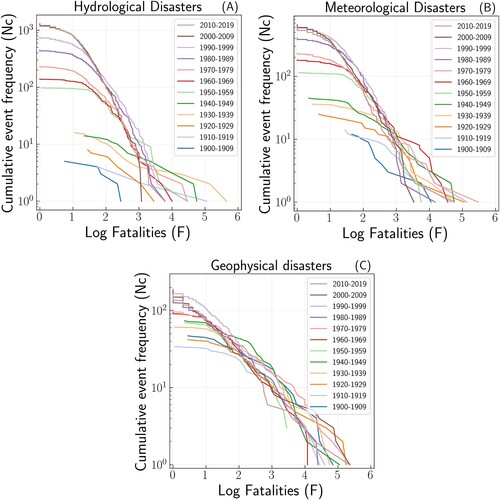
Figure 2. Ten-year running average of the annual number of (A) hydrological, (B) meteorological and (C) eophysical disasters per year in EM-DAT, separately for disasters with fatalities between 1–9, 10–99, 100–999, 1000 and above. For clarity, the annual data are not shown.
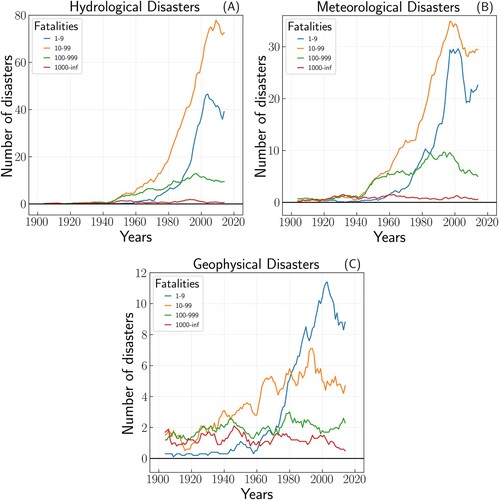
Figure 3. Ten-year running average (lines) of the total annual fatalities and annual data (dots) from (A) hydrological, (B) meteorological and (C) geophysical disasters per year in EM-DAT, separately for disasters with fatalities between 1–9, 10–99, 100–999, 1000 and above.
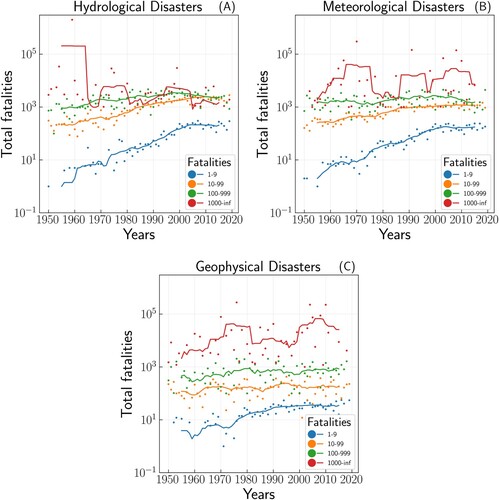
Figure 4. Frequency-fatality plots of data from two more limited but more detailed databases than EM-DAT, showing clear near power-law behaviour even for events with very few fatalities. (Left) NOAA storm events database (NOAA, Citation2023b) contains data from January 1950 to August 2023, with a large increase in the number of event types included since 1996. All time periods show near power-law behaviour. (Right) Wyss et al. (Citation2023) database mainly contains disasters with building collapse as the main cause. No separation between fatalities from landslides, fire and liquefaction exists, and total fatalities are used in all cases. The database does not contain the high-fatality events with tsunamis as a main cause of death, leading to fewer high-fatality events than on , ‘distorting’ the curves. Apart from the part of the curves affected by this effect, the near-linear behaviour continues to the low-fatality disasters.
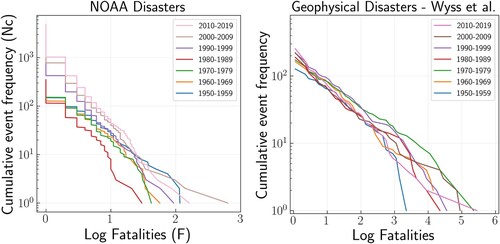
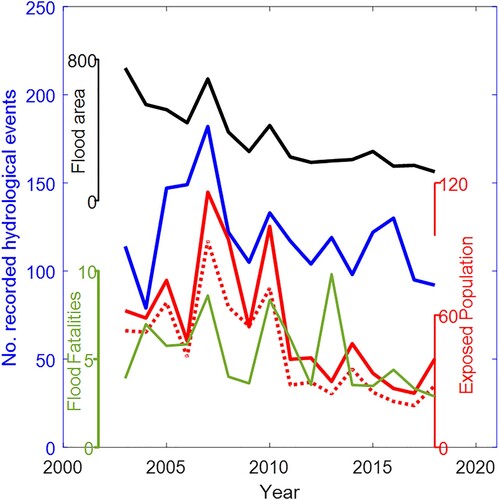
Figure 5. Annual flood area 2003–2018 estimated from satellite data (black, thousands ) and corresponding ‘exposed population’ and ‘adjusted exposed population’ (modified after Tellman et al. (Citation2021), red and dotted red, millions). Green is the annual flood fatalities in EM-DAT (thousands), and blue is the corresponding EM-DAT annual number of events. Note that the flood area and exposed population data for the years 2000–2002 of Tellman et al. (Citation2021) have been omitted due to the NASA Aqua satellite not coming into operation until 2002-05-04 (https://www.earthdata.nasa.gov/learn/articles/aqua-at-20 Accessed on 12/11/2023). The flooded areas for those years were likely to be underreported relative to the subsequent years (Tellman et al., Citation2021). Note also the decrease in the flood area estimates from 2003 to 2018, and the corresponding similar decrease in the number of hydrological disasters as well as the population exposure estimates. The apparently slightly anomalous peak in fatalities in 2013 is primarily due to a single Monsoon-induced flood event in one state in India (6000 fatalities).
Revised_main_supplement.CLEAN.docx
Download MS Word (842.6 KB)Data availability statement
The EM-DAT database, Version: 2023-05-10, was used in this study and is freely available upon registration at https://public.emdat.be/register.
Global population data was accessed from https://data.worldbank.org/indicator/SP.POP.TOTL. The NOAA data was accessed from https://www.ncdc.noaa.gov/stormevents/ftp.jsp and the (Wyss et al., Citation2023) data was accessed from https://fatal-earthquakes.icesfoundation.org/publications.html.