
Figures & data
Table 1. Descriptive statistics.
Figure 1. Histogram of IPCC predictions of temperature and drought at the post code level.
Notes: Kernel density estimates shown in red. Black, vertical line represent cut-off points for the mapping of predictions to expectations.
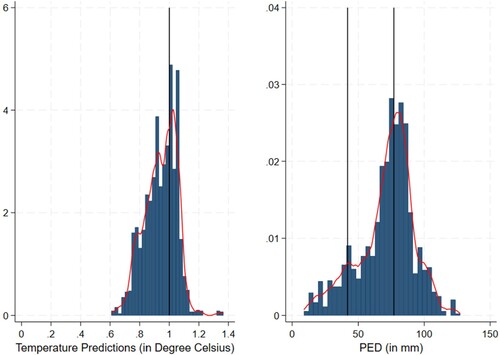
Figure 2. Mapping projections and expectations.
Notes: Figure shows mapping from IPCC projections (blue bar) to farmers’ expectations (grey bar). Left panel shows temperature and right panel shows drought. Observations with ‘unsure’ responses dropped.
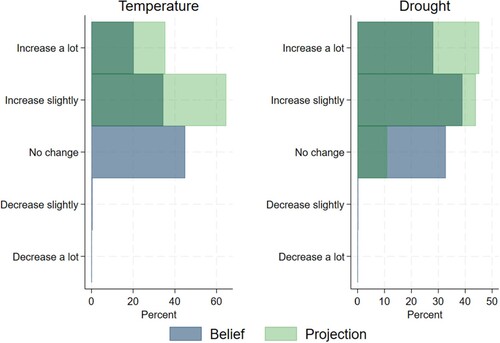
Table 2. Regression results
Figure 3. Determinants of concordance in expectations with IPCC projections of future temperature.
Notes: Results from ordered logit regression with 95% confidence bands. All regressions include industry and region fixed effects. Constant not shown.
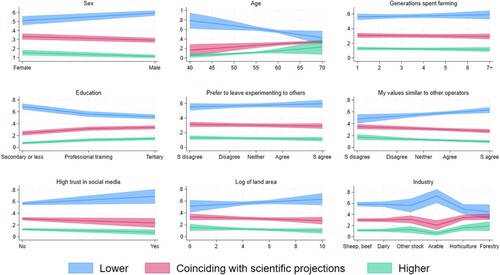
Figure 4. Determinants of concordance in expectations with IPCC projections of future drought.
Notes: Results from ordered logit regression with 95% confidence bands. All regressions include industry and region fixed effects. Constant not shown.
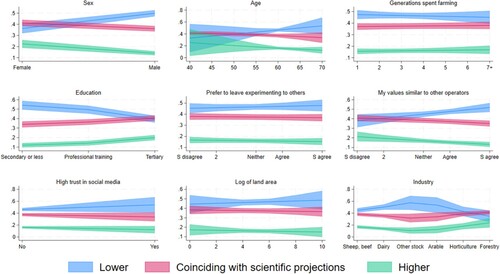
Table 3. Regression results.
Table 4. Regression results.