Figures & data
Figure 1. The different types of brittle failure for connections with large diameter fasteners and the definition of the lateral L and the head H failure planes for the row and block shear failure modes.
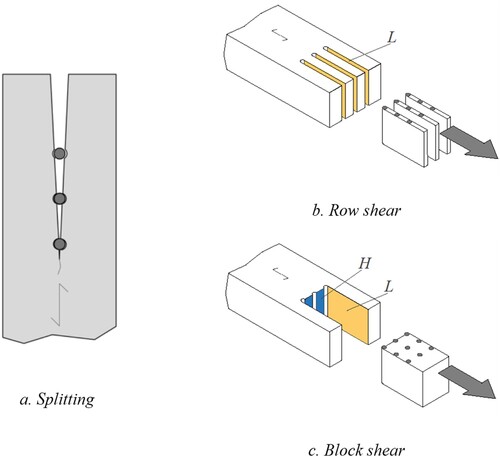
Figure 2. Analysed connections types, with the definition of the different geometrical parameters. From left to right: front view of the connections; lateral view of the two analysed types WSW and SWS.
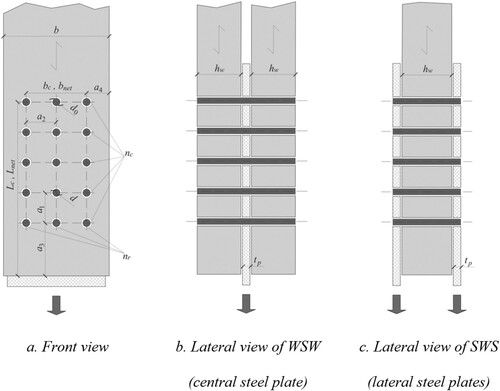
Table I. Distribution characteristics according to JCSS (Citation2006) and property values used in the present study.
Table II. Correlations of parameters A, B, C and D for the generation of embedment strength.
Table III. Correlation of parameters for strength and stiffness values given .
Figure 3. Examples of the simulated material properties.
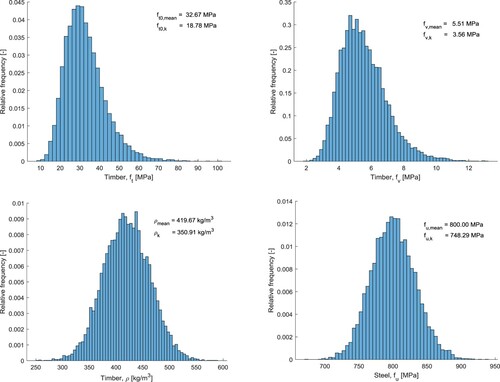
Figure 4. Changing of probability distributions of brittle (red) and ductile (black) failure capacities for WSW connection. Top: the effect of increasing timber thickness (hw/d) (a1=5d). Bottom: the effect of increasing parallel spacing (a1) (hw=20d).
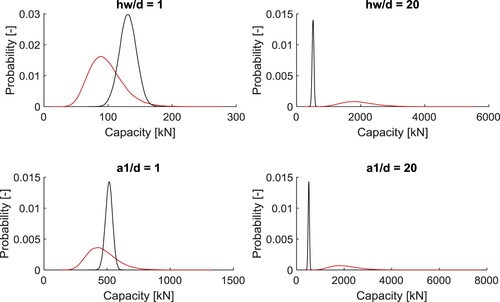
Figure 5. Effect of changing timber thickness (hw/d) on characteristic strength (top) and likelihood of brittle failure (bottom) (WSW, a1=5d). (Legend: Bc – brittle resistance, Dc – characteristic ductile resistance, Deff,c – reduced characteristic ductile resistance), B5, D5 – 5th-percitle values of the simulated brittle and ductile failure capacities, P(B < D) – probability that the brittle capacity is lower than the ductile one, CV(R) – coefficient of variation of connection resistance.
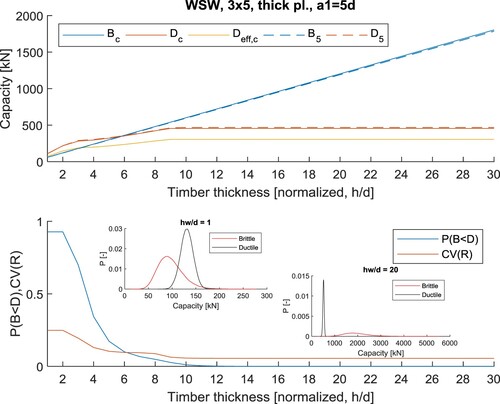
Figure 6. Effect of changing parallel spacing (a1) on characteristic strength and likelihood of brittle failure (WSW, hw=20d). (Legend: Bc – brittle resistance, Dc – characteristic ductile resistance, Deff,c – reduced characteristic ductile resistance), B5, D5 – 5th-percitle values of the simulated brittle and ductile failure capacities, P(B < D) – probability that the brittle capacity is lower than the ductile one, CV(R) – coefficient of variation of connection resistance.
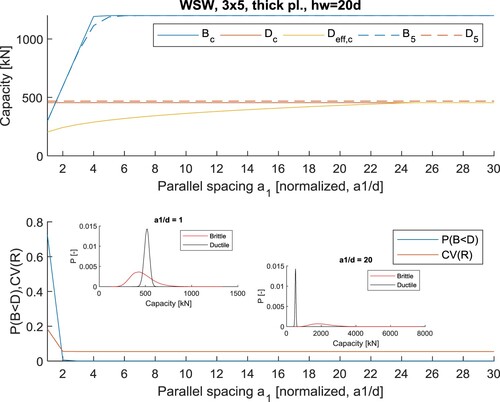
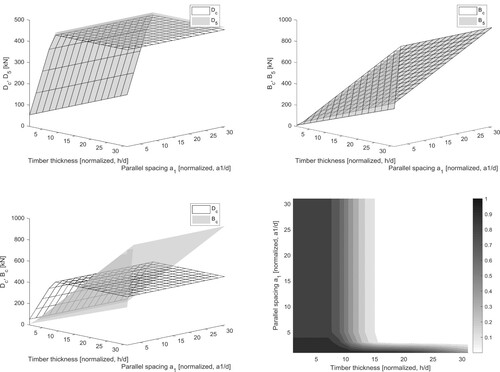
Figure 7. Characteristic vs 5th percentile values for ductile (top left) and brittle (top right) failure capacity; characteristic brittle vs ductile failure capacities (bottom left) and probability of brittle failure governing (bottom right) (WSW).
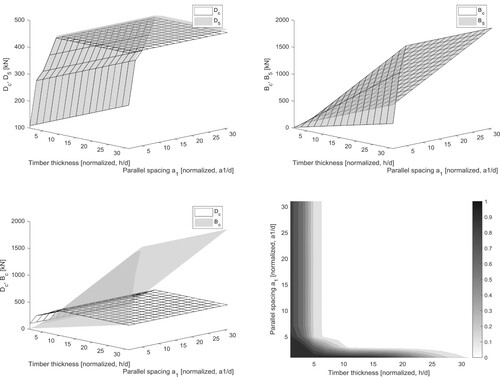
Figure 8. Changing of probability distributions of brittle (red) and ductile (black) failure capacities for SWS connection. Top: the effect of increasing timber thickness (hw/d) (a1=5d). Bottom: the effect of increasing parallel spacing (a1) (hw=20d).
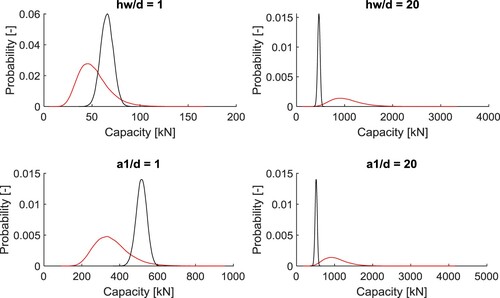
Figure 9. Effect of changing timber thickness (hw/d) on characteristic strength and likelihood of brittle failure (SWS, a1=5d). (Legend: Bc – brittle resistance, Dc – characteristic ductile resistance, Deff,c – reduced characteristic ductile resistance), B5, D5 – 5th-percitle values of the simulated brittle and ductile failure capacities, P(B < D) – probability that the brittle capacity is lower than the ductile one, CV(R) – coefficient of variation of connection resistance.
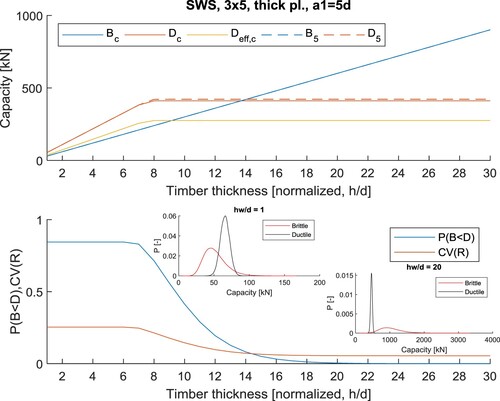
Figure 10. Effect of changing parallel spacing (a1) on characteristic strength and likelihood of brittle failure (SWS, hw=20d). (Legend: Bc – brittle resistance, Dc – characteristic ductile resistance, Deff,c – reduced characteristic ductile resistance), B5, D5 – 5th-percitle values of the simulated brittle and ductile failure capacities, P(B < D) – probability that the brittle capacity is lower than the ductile one, CV(R) – coefficient of variation of connection resistance.
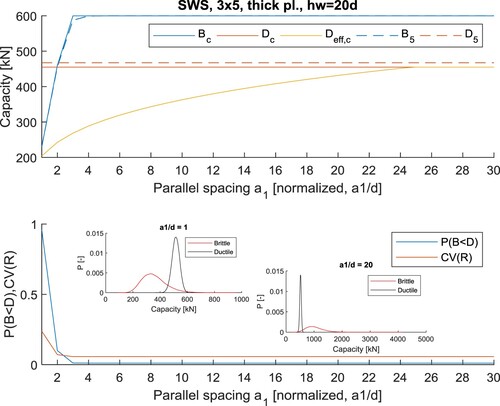
Figure 11. Characteristic vs 5th percentile values for ductile (top left) and brittle (top right) failure capacity; characteristic brittle vs ductile failure capacities (bottom left) and probability of brittle failure governing (bottom right) (SWS).