Figures & data
Figure 1. Poplar specimens prepared for flexure tests. (A) un-densified 15 mm thickness, (B) densified to 7 mm, (C) densified to 5 mm, and (D) densified to 2 mm.
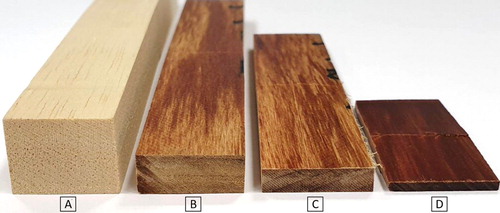
Table 1. Pressing parameters for densification.
Figure 2. Micrograph of impregnated, densified spruce with a 2 mm target thickness. (A) Penetrated phenol resin present in lumens and (B) collapsed tracheids.
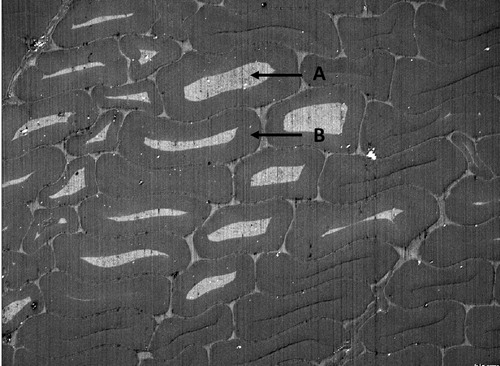
Table 2. THM and resin treatment data for beech, poplar, and spruce specimens.
Figure 3. Mean density profiles of beech (first row), poplar (second row), and spruce (third row) specimens.
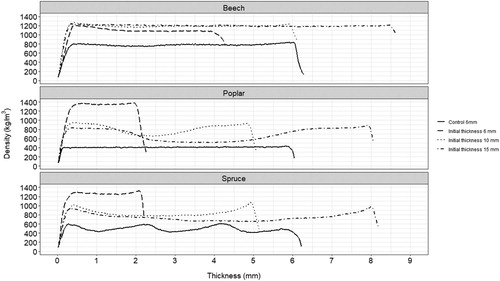
Table 3. Mechanical test data of impregnated, THM treated specimens (mean values ± 1 standard deviation), and reference values.
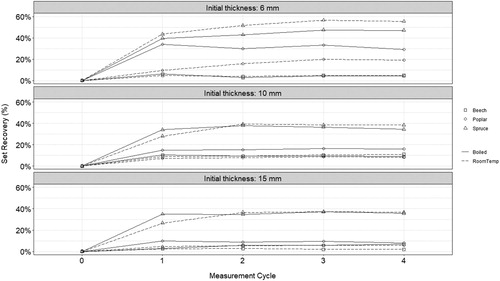
Figure 4. Set-recovery of THM-treated specimens grouped by initial thickness.