Figures & data
Table 1. Results of the product-grade reference and image-grade reference of the baseline training data set consisting of 251 planks.
Figure 1. Flow-chart showing the different training scenarios and prediction models. Solid boxes represent models trained on the product-grade (P) or the image-grade (I), respectively. Dotted boxes show the different training scenarios where the two models are compared with the baseline training scenario.
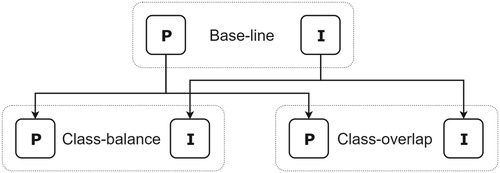
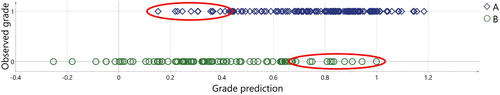
Figure 2. The observed-predicted plot of the baseline training data, using the model trained on the baseline training data with the product-grade reference. The upper observations (1) represents grade A, and the lower (0) represents grade B. The y-axis shows the grade of each plank as the actual binary grade, and the x-axis shows the continuous grade predicted by the model. The encircled observations have a weak correlation between their measured features and their assigned grade, i.e. an observation in the bottom right looks to the model as, and would have been predicted as, a plank of grade A (1) while the product-grade was grade B (0).