
Figures & data
Figure 1. Nine strategic groups with the SFI (the sizes of the bubbles represent total revenue in 2017 of the different SGs).
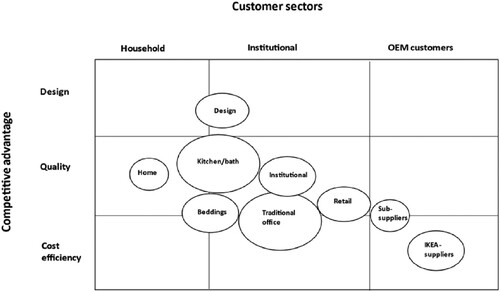
Table 1. The Swedish furniture industry – growth and profitability.
Table 2. The Swedish furniture industry – comparison between revenue-weighted and unweighted ROA figures.
Table 3. Estimates of explanatory and performance variables as a basis for qualitative analysis.
Table A1. The Swedish furniture industry – comparison of revenue and number of employees in 2004 and 2017.
Table A2. The Swedish furniture industry – firm sizes among SGs.