
Figures & data
Figure 1. Material flow chart. The procedure was as follows, following the nomenclature in the flow-chart above 1, data collection of the entire dataset through the entire process. 2, simulated sorting comparing the sorting outcome of the rule-based approach with the PLS-based approaches. A, the 156 logs selected for the study. B, CT-scanning of all the logs by the CT Log. C, the rule-based approach optimising and deciding on the sawing. and
, two PLS models correlating variables
from the CT-scanning and the product-grade
, or image-grade
, quality references. C and D can classify the virtual sawn timber as the main product intended for the customer or, if not suitable for this customer, as a main product for a different customer. E, additional rules applied to C and D to remove outliers only during the simulated sorting. F, sawing the log. G, kiln drying the sawn timber. H, the Boardmaster at the dry-sorting station capturing images of the sawn material whose image-grade is used as a quality reference for
. I, additional rules applied to remove outliers. J, a piece of sawn timber delivered to the customer receiving a quality product-grade
based on K. K, split, milled, and quality graded wall panels by the customer.
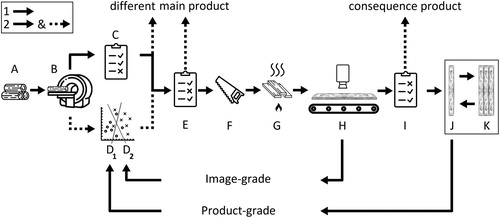
Figure 2. Example of images used for image-based grading. All four faces of the sawn timber are shown.
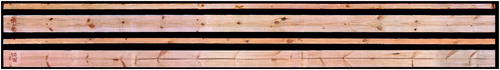
Table 1. Material quality grade distribution.
Table 2. Sorting outcome using the customer-adapted rule-based grading in the CT Log and using the complementary rules in the CT Log and the Boardmaster.
Table 3. Sorting outcome using the product-trained PLS model in the CT Log and using the complementary rules in the CT Log and the Boardmaster.
Table 4. Sorting outcome using the image-trained PLS model in the CT Log and using the complementary rules in the CT Log and the Boardmaster.
Table 5. Sorting outcome specific to the complementary rules (E) in the CT Log for the rule-based grading method and the two PLS-based methods.