Figures & data
Figure 1. Hanstad Primary School, Elverum, Norway. Façade facing south (top left), west (top right), east (bottom left) and north (bottom right).
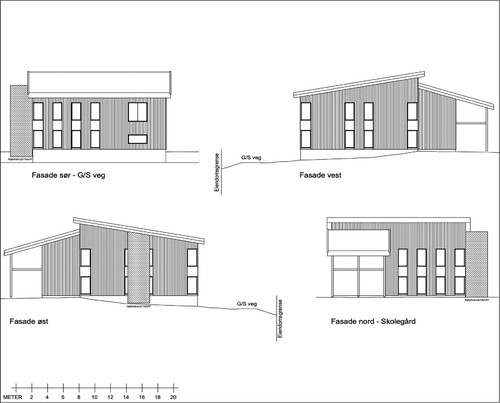
Figure 2. View of north façade January 2020. Classrooms 107 and 207 are located on the right-hand side of the building.
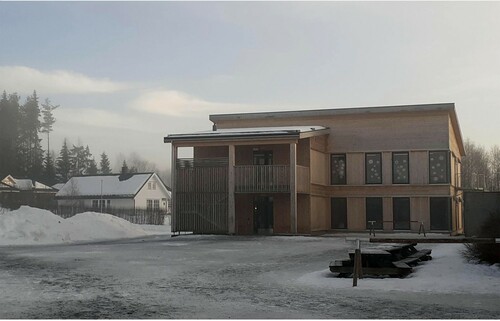
Table 1. Description of classrooms 107 and 207.
Figure 3. Layout of classrooms on the ground floor (left) and first floor (right). Classrooms 107 and 207 are the subject of this study.
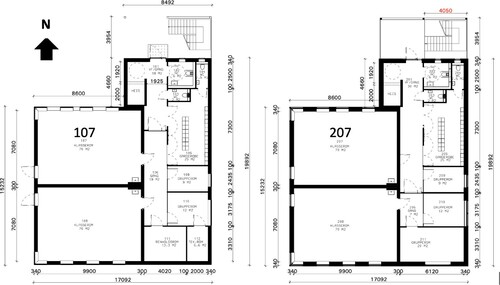
Figure 4. Interior of classroom 107.
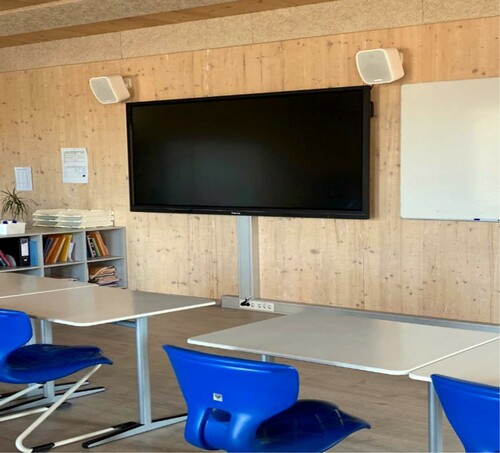
Table 2. Description of rooms during the study period (28 September to 1 November 2020).
Figure 5. CO2 levels in classrooms 107 and 207 over 28 September 2020 to 1 November 2020.
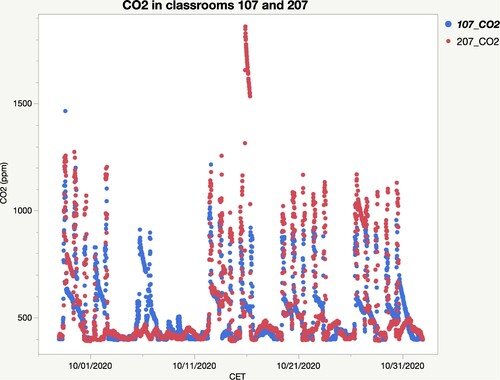
Figure 6. Sensors mounted in the two classrooms: ground floor (107) and first floor (207). Red x indicates approximate measurement point (ceiling, wall inside, wall outside). Text in frames lists parameters measured.
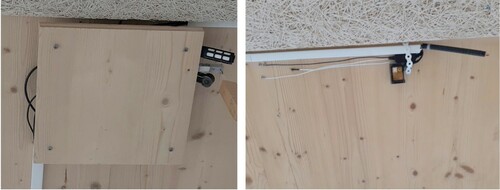
Table 3. Sensors used to measure indoor parameters in each room.
Figure 7. Relative humidity outside (left) and inside (right) during 28 September to 1 November.
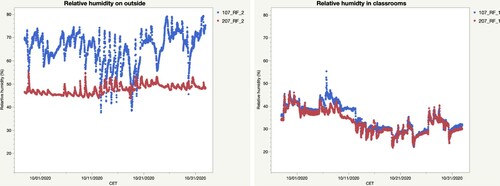
Figure 8. Air temperature outside (left) and inside (right) during 28 September to 1 November.
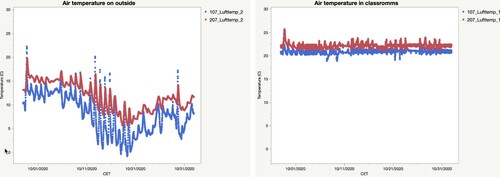
Table 4. Descriptive data, air temperature and relative humidity (RH) during the study period (28 September 2020 to 1 November 2020).
Table 5. Relative humidity and temperature in indoor air and relative humidity in wood at different periods.
Figure 9. Corrected relative humidity in classrooms during 28 September to 1 November.
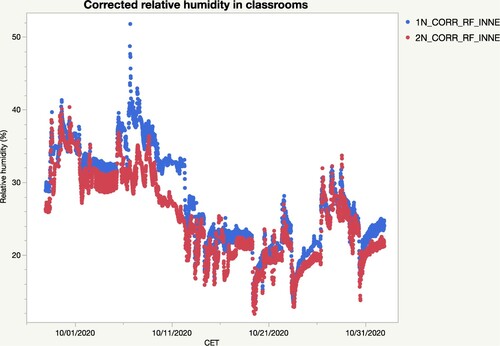
Figure 10. Normalized wood moisture content in classrooms during 28 September to 1 November.
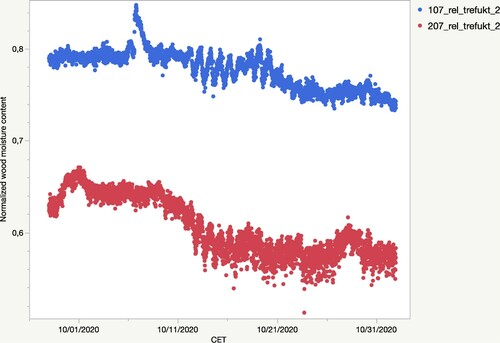
Table 6. Associations between indoor relative humidity and relative wood humidity without and with ventilation in the untreated room. Analysed with a multiple linear regression model, study weeks No 1 and 4.
Table 7. Associations between indoor relative humidity and wood humidity without and with ventilation in the room with treated walls and roof. Analysed with a multiple linear regression model, study weeks No. 1 and 4.
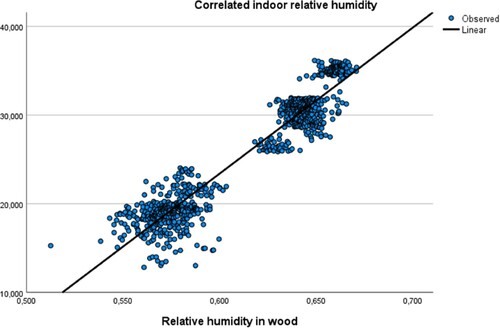
Figure 11. Regression line on the relative humidity in wood and relative humidity in indoor air, untreated room and no ventilation, study weeks No. 1 and 4.