Figures & data
Figure 1. Reference building at NMBU.
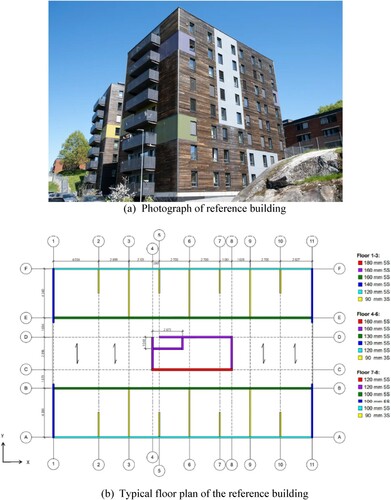
Figure 2. Typical layout of shear walls in reference building.
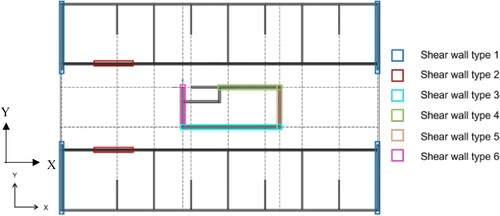
Table 1. Specifications of shear walls and connectors.
Table 2. Description of Python scripts.
Figure 3. Baseline FE superstructure model.
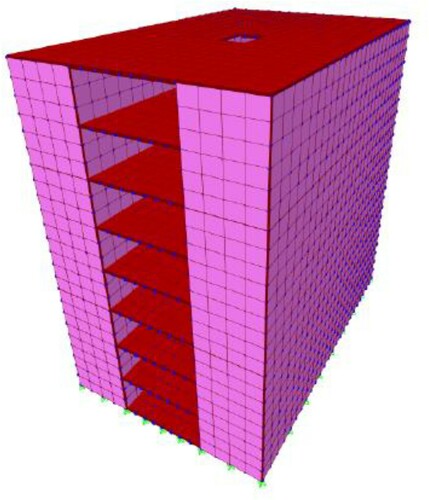
Figure 4. Normalized sensitivity values of material properties.
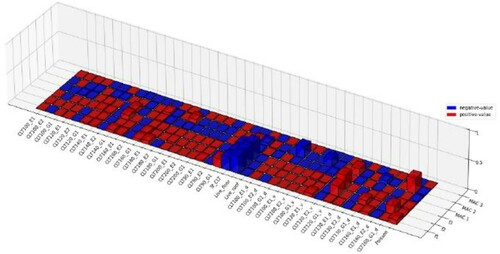
Table 3. Reference (seed) properties for CLT elements*.
Table 4. Seed values for loads and material density.
Table 5. Initial and updated parameter values with an absolute change greater than 1.0% during sensitivity analyses.
Figure 5. Convergence of the cost function during model updating.
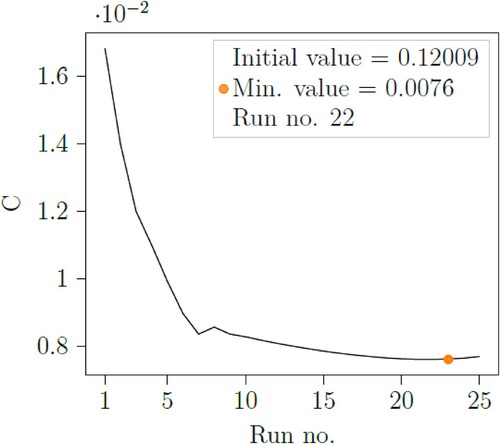
Figure 6. FE model versus experimental mode shapes.
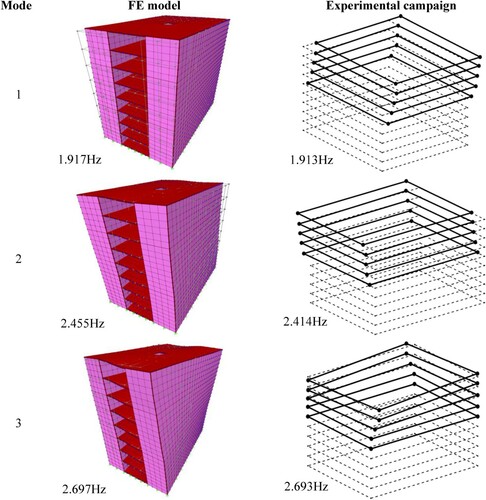
Table 6. FE models versus experimental natural frequencies.
Figure 7. Schematic of wall-to-floor link objects.
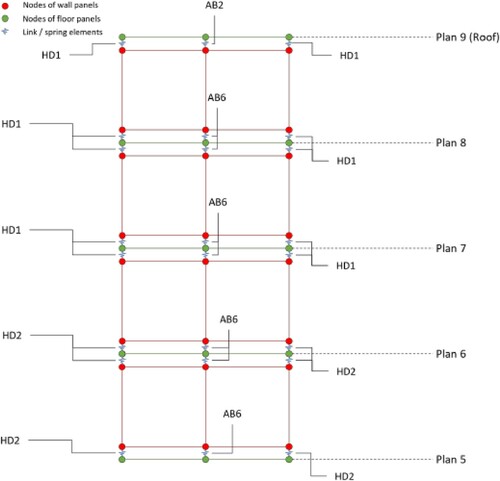
Table 7. Stiffness of angle bracket and hold-down anchors in FE analyses.
Table 8. Overview of the types of angle brackets employed in the FE analyses.
Figure 8. Normalised sensitivity values for connector parameters.
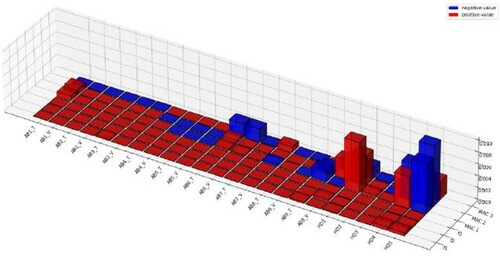
Figure 9. Variations in building footprint.
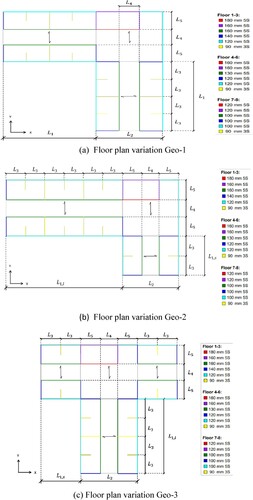
Table 9. Effects of variations of plan geometry on natural frequencies and mode types.
Table 10. Number of modes contributing to 90% mass participation.
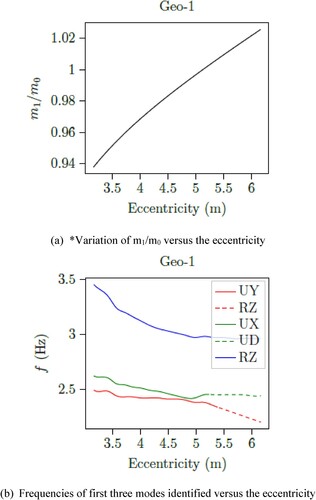
Figure 10. Variations in eccentricity versus corresponding masses and natural frequencies, respectively.