Figures & data
Figure 1. Proposed chair construction and L-shaped mortise-and-tenon joint made with 3D-printed connectors. The dimensions of the chair were as follows: seat height 435 mm, seat width 420 mm, total height 762 mm, angle of backrest 97°. The cross section of the legs was 35 × 35 mm and that of the rails 30 × 50 mm.
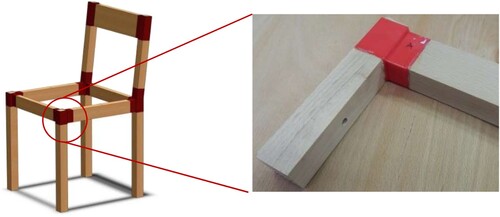
Figure 2. 3D-printed connectors A, B, C, D with dimensions.
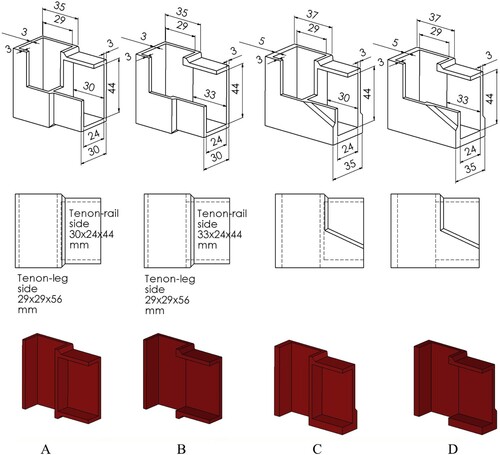
Figure 3. Joint testing: (a) the diagram of joint loading, (b) working diagram of joint strength testing.

Figure 4. The physical model and mesh of the joints: (a) connector - type 1 (A- without inner wall), (b) reinforced connector – type 2 (C – without inner wall).
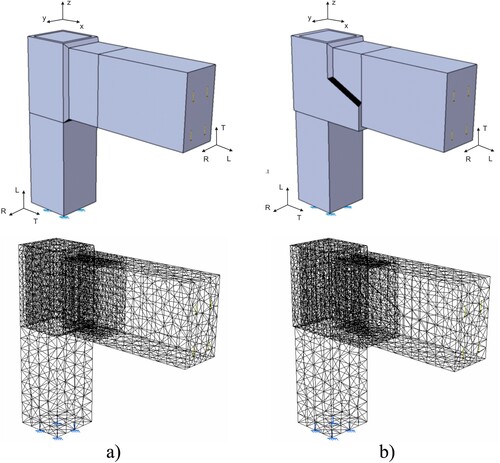
Table 1. Elastic properties of beech wood (Smardzewski Citation2008).
Figure 5. Average failure load (N) for the various 3D-printed connectors and wood mortise-and-tenon joints.
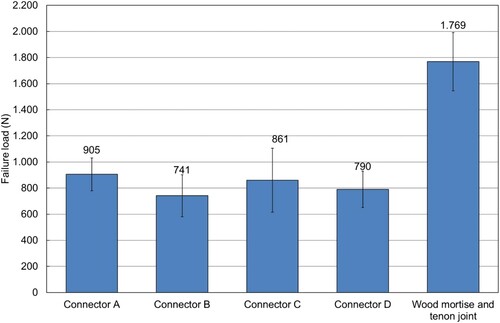
Figure 6. Typical failures for the 3D-printed connector (connection between front leg and side rail): connector type A (top three photos), vertical sections of connector type A (bottom left) and vertical sections of connector type B (bottom right).
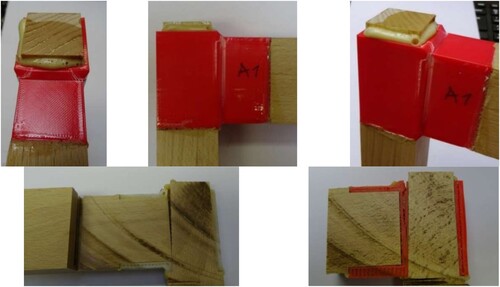
Figure 7. Deformation of joints obtained by numerical calculation: (a) connector A – I mod (left) and III mod (right), (b) (a) connector C – I mod (left) and III mod (right).

Figure 8. Distribution of von Mises stress of the first type of connectors: (a) connector A – I mod (left) and III mod (right), (b) (a) connector B – I mod (left) and III mod (right).
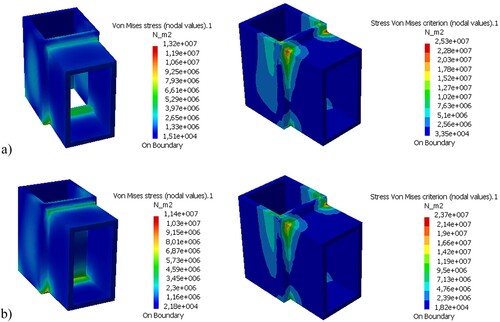
Figure 9. Distribution of von Mises stress of the second type of connectors: (a) connector C – I mod (left) and III mod (right), (b) (a) connector D – I mod (left) and III mod (right).
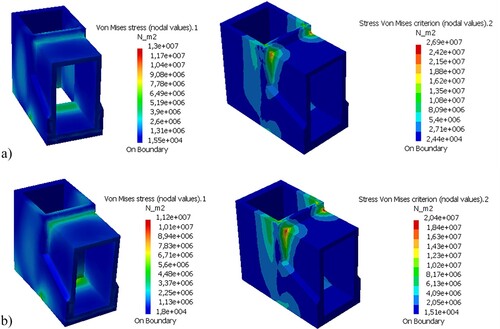
Table 2. Normal stress in the cross section of the rail at a distance of 80 mm from the applied load.
Figure 10. Cross section of a composite part of the joint (length ) and distribution of normal stress: (a) first type of connector (connectors A and B), (b) second type of connector (connectors C, D).
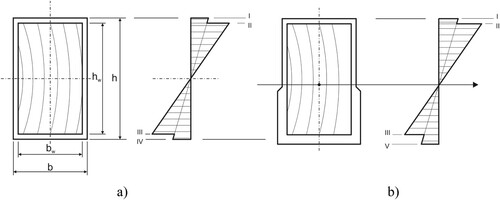
Figure 11. Distribution of normal stress of the first type connectors: (a) III mod of connector A – connector (left) and wooden rail (right), (b) (a) III mod of connector B – connector (left) and wooden rail (right).
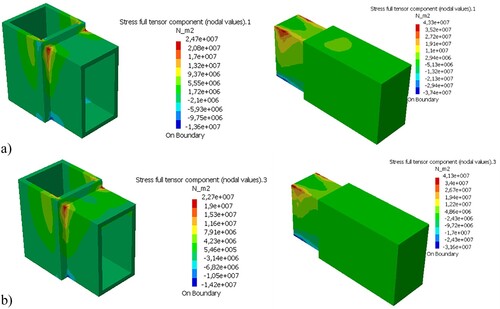
Figure 12. Distribution of normal stress of the second type of connectors (reinforced): (a) III mod of connector C – connector (left) and wooden rail (right), (b) (a) III mod of connector D – connector (left) and wooden rail (right).
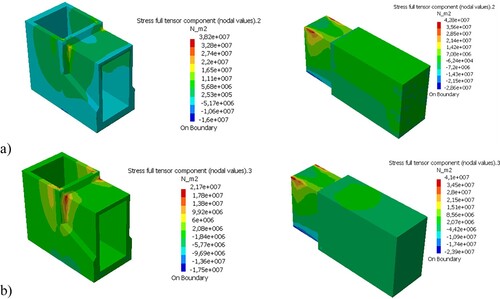
Figure 13. Stiffness coefficient K of the joints with connectors.
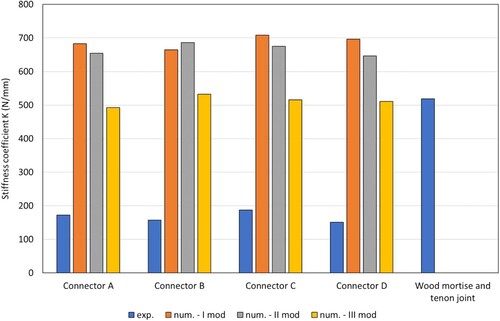
Table 3. The experimental and numerical stiffness coefficient K of the joints with connectors.
Table 4. The ratios of the stiffness coefficients K of the joints with four different connectors.
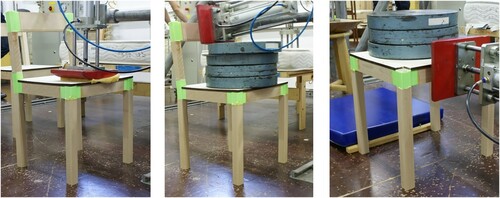
Figure 14. From left to right: seat loading test, seat and back loading test, front edge forward loading test.