Figures & data
Figure 1. Schematic representation of the investigated structure typologies, based on Fazlur Kahn (Ali and Moon Citation2007) (left) and schematic representation of the tube-in-tube system with its structural behaviour (right).
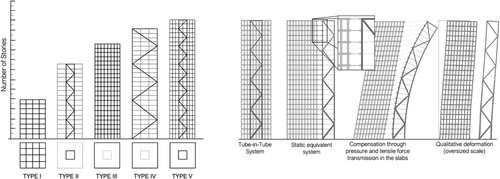
Figure 2. Tube-in-tube system.
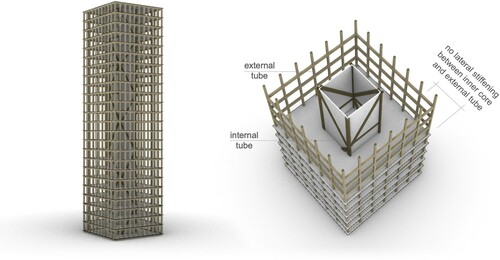
Figure 3. Structural system (left) and the statically equivalent model for determining the rotational stiffness of the beam-column joint (right).
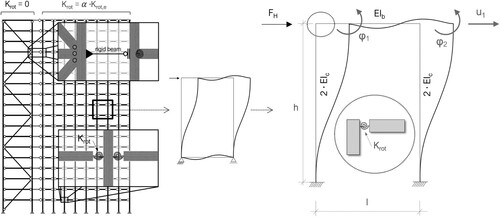
Figure 4. Statically equivalent member dimensions representing the approach of the joint stiffness Krot in comparison to the member dimensions.
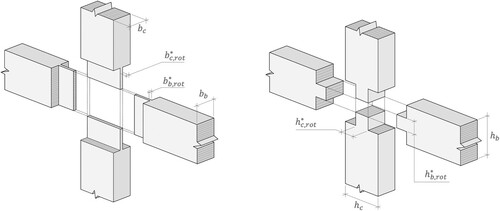
Table 1. Overview of the simulation-parameters for the different systems.
Figure 5. Illustration of the parameters.
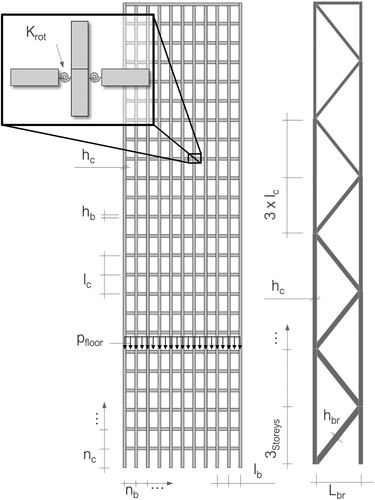
Figure 6. Comparison of the peak accelerations and the natural frequency fn (left) for the analysed tube-in-tube systems (right).
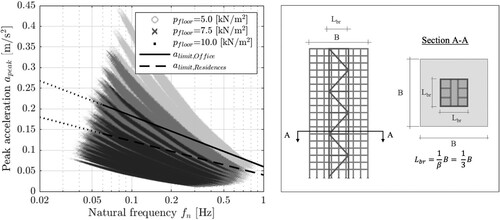
Figure 7. A single-degree-of-freedom system (a) is used to represent the building stiffness in the first mode. The equivalent spring-mass system (b) is denoted by the stiffness K (c).
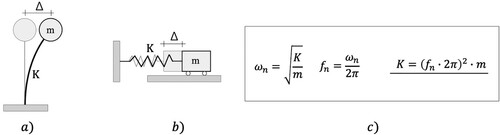
Figure 8. Comparison of parameters with constant reference values. The reference values are: nc = 33, vb,0 = 25.0 m/s, pfloor = 7.5 kN/m2, δs = 0.05.
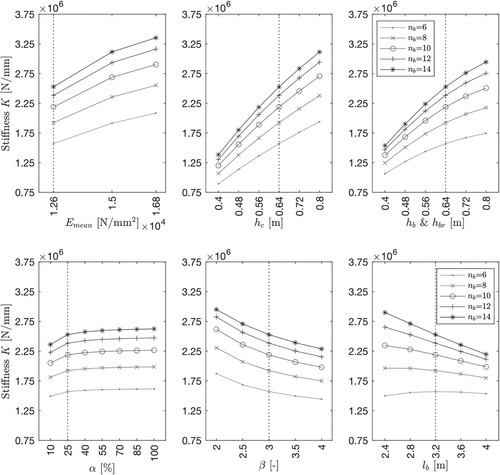
Figure 9. Natural frequencies for different building heights and widths.
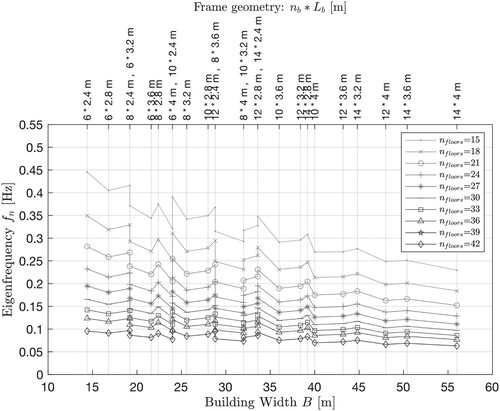
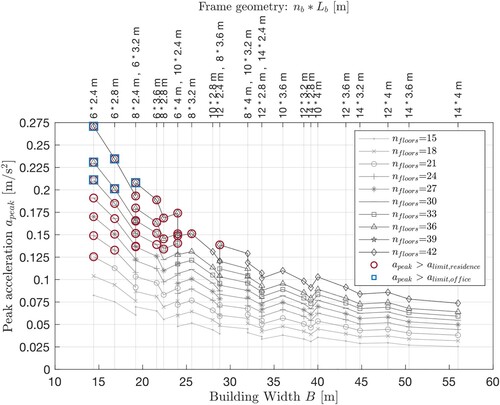
Figure 10. Peak accelerations for different building heights and widths.