Figures & data
Figure 1. Profiles of the planks for the roof of the Golobar cable yarding.
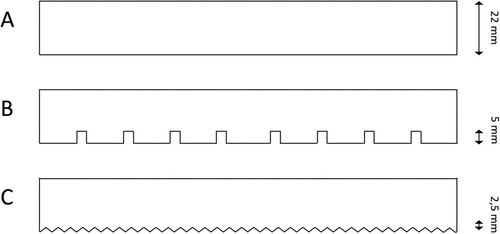
Figure 2. Golobar cable yarding. The roof covered with wooden tiles made of various wood-based materials is clearly seen.
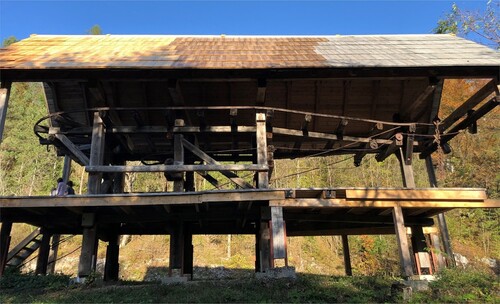
Table 1. Materials and machining used in the production of the planks used for the Golobar cable yarding.
Table 2. Aggregated data from wood moisture monitoring at the Golobar cable yarding. Each value represents 2214 measurements.
Figure 3. Distribution of (A) relative humidity (RH) and temperature, (B) precipitation and (C) wood moisture content during the monitoring period between 17 October 2019 and 28 October 2023 at Golobar cable yarding. The wood MC monitoring locations are listed in .
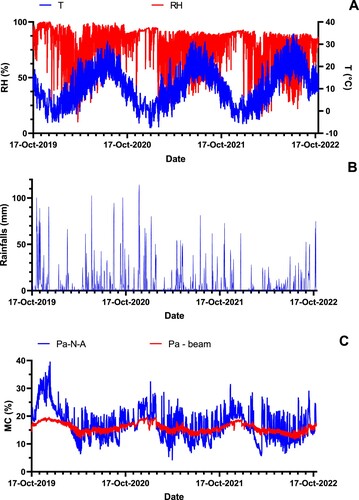
Figure 4. Correlation between ten-day average relative humidity (RH), rainfall and moisture content of wood during the monitoring period between 17 October 2019 and 28 October 2023 at the Golobar cable yarding. Wood MC monitoring sites are resolved in .
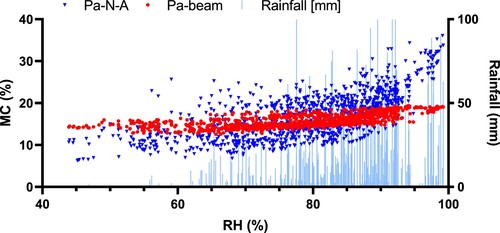
Figure 5. Influence of shingle design on the moisture content of Norway spruce wood shingle during the monitoring period between 17 October 2019 and 28 October 2023 at Golobar cable yarding. Wood MC monitoring sites are resolved in .
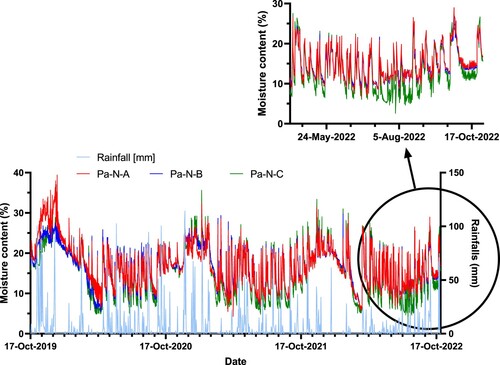
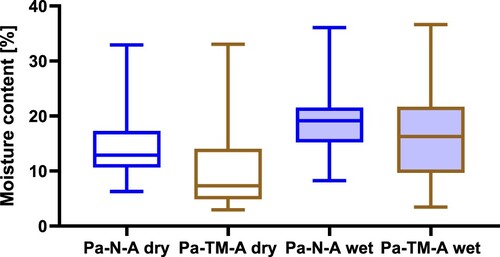
Figure 6. Moisture content of wooden shingles in wet and dry periods during the monitoring period between 17 October 2019 and 28 October 2023 at the Golobar cable yarding. Wood MC monitoring locations are resolved in .