Figures & data
Table 1. Overview of harvested trees.
Figure 1. Cross-section of a Norway spruce (group No. 3) were the sapwood was completely blue-stained at the time of felling.
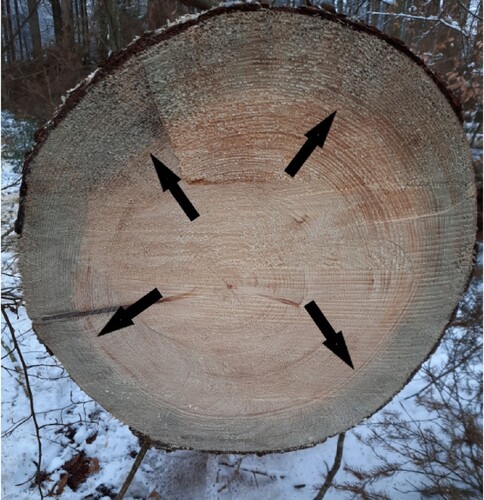
Table 2. The number of specimens used for testing the different material properties.
Figure 2. Hyphae of blue-staining fungi (orange arrow) and wood-degrading fungi (blue arrows) in tracheids of bark beetle infested spruce sapwood.
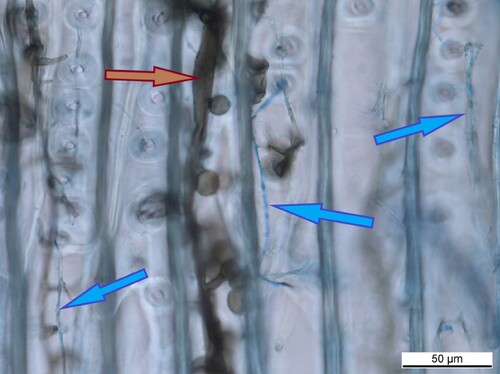
Figure 3. Density at a MC of 12%. Groups according to .
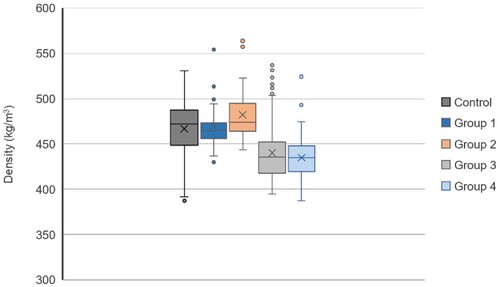
Figure 4. Specific Impact bending strength (IBSspecific).
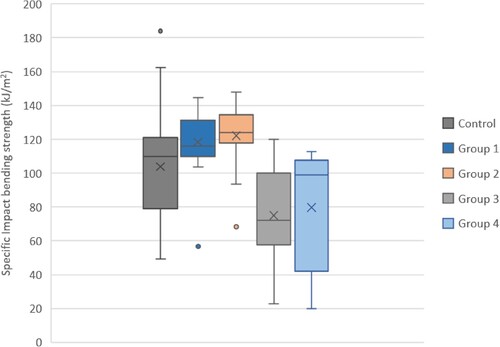
Figure 5. Examples of fractured surfaces after impact bending: fibrous, non-brittle (green coloured frame) and brittle (red coloured frame) in the tensile zone.
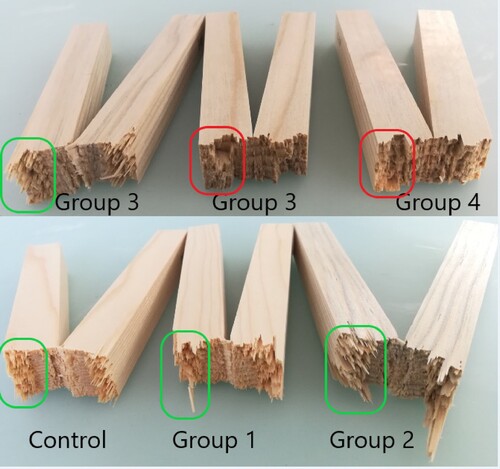
Figure 6. Modulus of elasticity (MOE) in 3-P-bending.
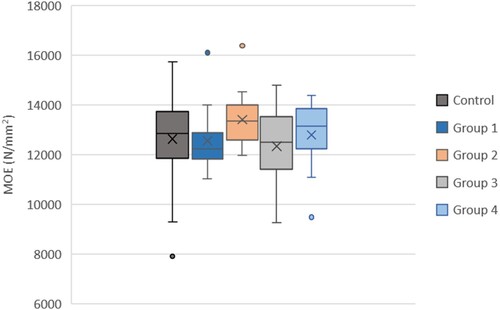
Figure 7. Specific modulus of rupture (MORspecific) in 3-P-bending.
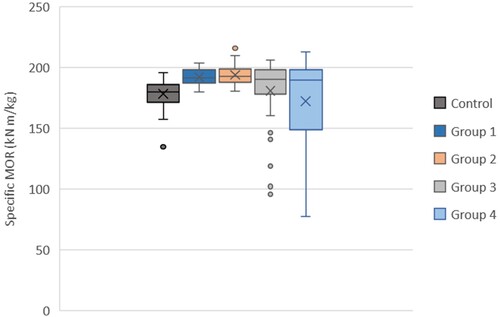
Figure 8. Force-deflection graph; representative example of a ductile (non-brittle) and a brittle fracture behaviour of blue-stained specimen of group No. 3.
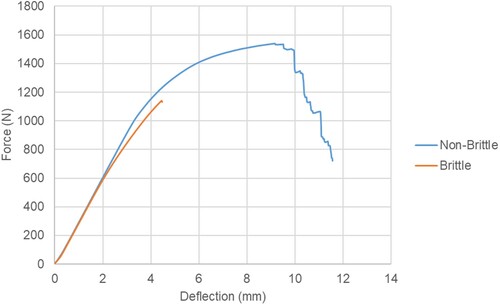
Figure 9. Fracture pattern of blue-stained samples after 3-P-Bending; a) fibrous fracture pattern in the tensile zone, b) plane fracture pattern across the entire fractured surface.
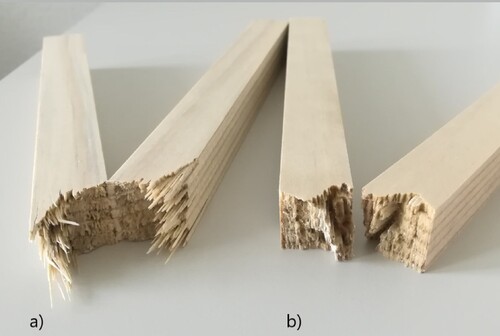
Table 3. Mechanical properties of Norway spruce determined at a MC of 12%. Grey shaded cells indicate significantly lower values to the control. Statistical data are given in the Supplementary information Table A1.
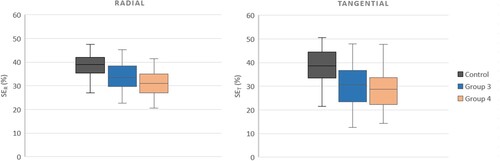
Figure 10. Elastic recovery at radial surfaces (SER) and tangential surfaces (SET).