Figures & data
Figure 1. Face milling method according to DIN 8589 Part 3. left: circumferential face milling (planing), right: face milling, vc: cutting speed, vf: feed rate (following DIN 8589-3).
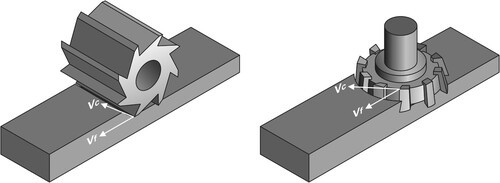
Figure 2. Compacted zone of the wood structure after milling with the blunted cutter 1, cutting with the fiber (compaction depth 250 µm); Scale 1,200. Source: PhD thesis K. Rehm, TU Dresden.
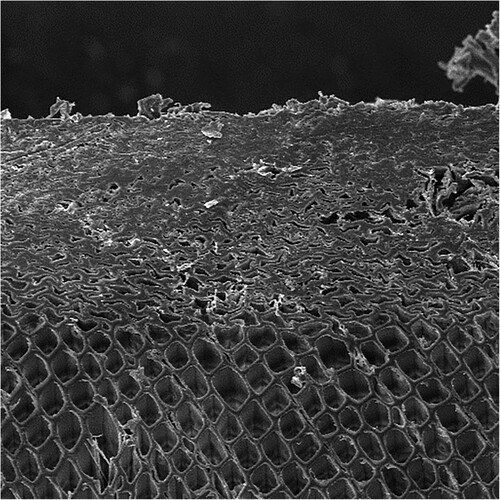
Figure 3. Influence of the angle between cut and grain direction on the quality of the surface.
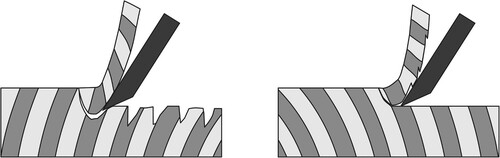
Figure 4. Comparison of surface finish (top: sawn, bottom: face milling). Source: BA Sachsen.
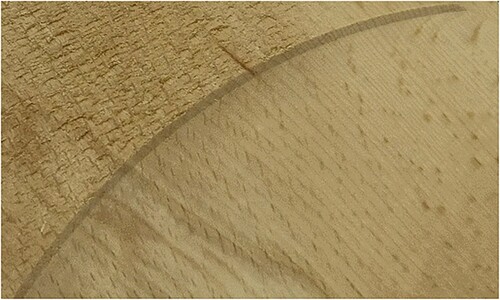
Figure 5. Valley quotient according to Neusser cited in (Troeger and Schneider Citation2015); Dependence on (fz) and (d). Source: IfW.
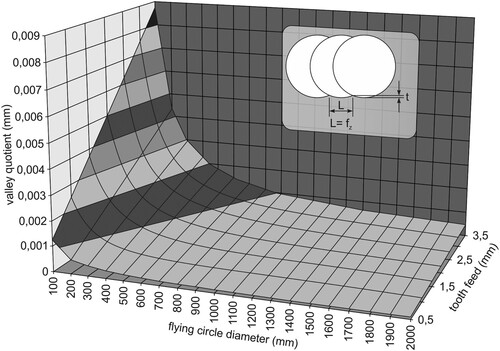
Figure 6. Deformation zone when sawing softwood with convex secondary cutting teeth. Source: unpublished lecture notes “Fundamentals of woodworking” IfW Stuttgart.
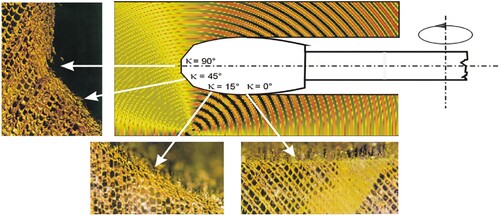
Figure 7. Finishing tool and (exemplary) chip of a finished beech wood surface. Source: BA Sachsen.
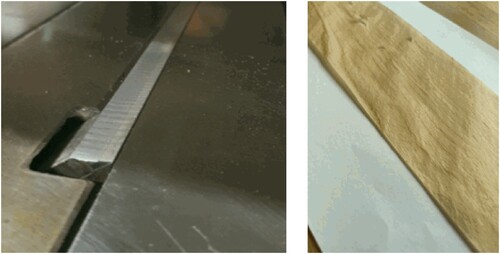
Table 1. Test overview.
Figure 8. Test setup for face milling: Left straight cutting edge, right crowned cutting edge.
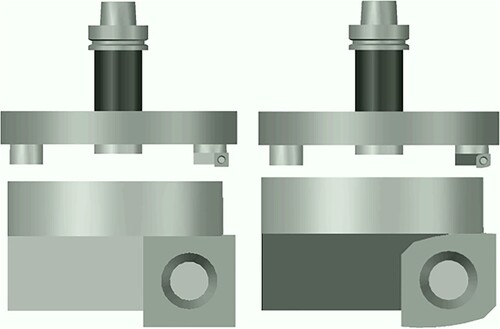
Figure 9. Roughness after water application (13 g/m²) and re-drying (measured in the fiber direction).
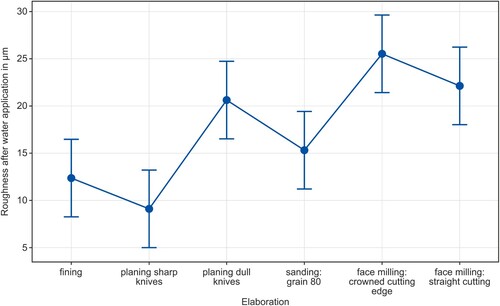
Figure 10. Tensile shear strength after storage sequence A1, A4, and A5 as a function of the type of surface treatment.
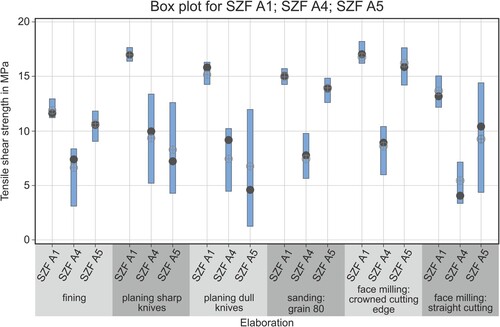
Table 2. Percentage of wood broken.
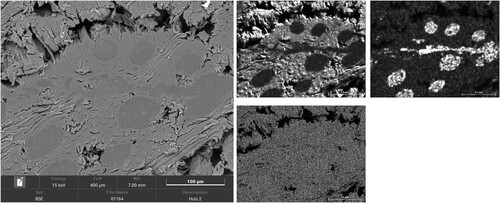
Figure 11. Adhesive joint Sample 2: Detail section 3 from – SE image left, BSE image right; Element distribution of O, C, and Si measured with EDX.