Figures & data
Figure 1. Division of notices [after 21].
![Figure 1. Division of notices [after 21].](/cms/asset/fda0ed89-9f29-4638-9da4-291a56472877/nsme_a_1386756_f0001_b.gif)
Table 1. The entropy rate [after 1].
Table 2. Indicator of boundary contrasts for particular types of land cover [after 1 and 12].
Table 3. Landscape attractiveness of the abandoned quarries – classification groups [after 12].
Figure 2. Location of selected units in the Ślęża region [after 1, modified).
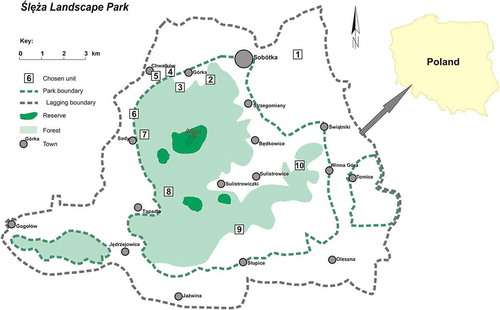
Figure 3. Location of the British units selected to the comparative studies.
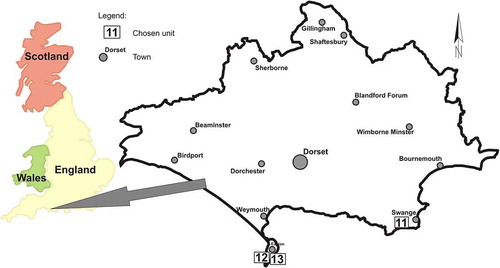
Figure 4. Location of the Austrian units selected to the comparative studies.
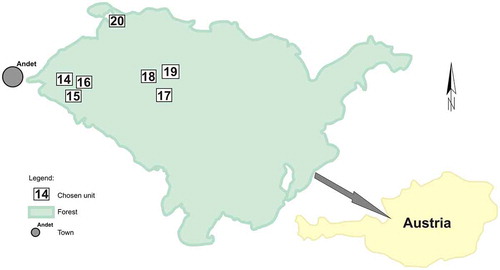
Figure 5. Quarry No. 4.
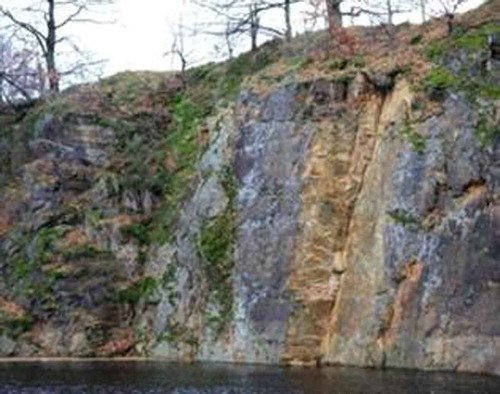
Figure 6. Quarry No. 10.
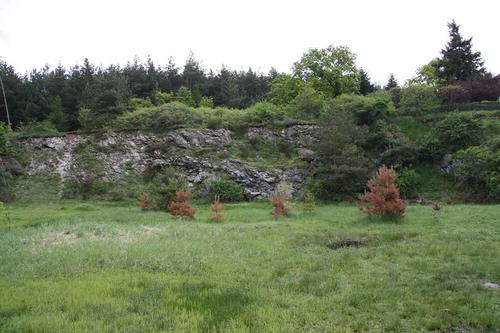
Figure 7. Quarry No. 11.
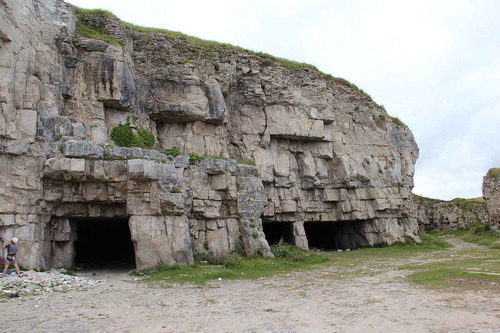
Figure 8. Quarry No. 12.
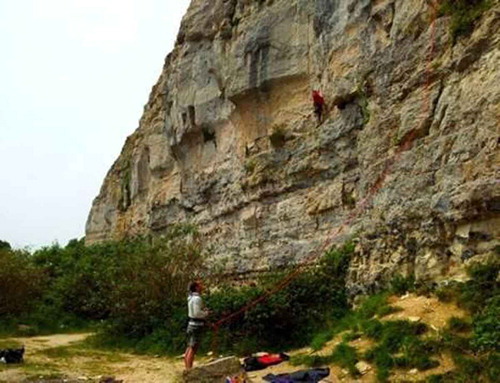
Figure 9. Quarry No. 15.
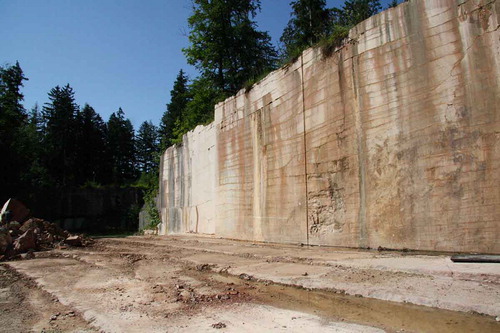
Figure 10. Quarry No. 18.
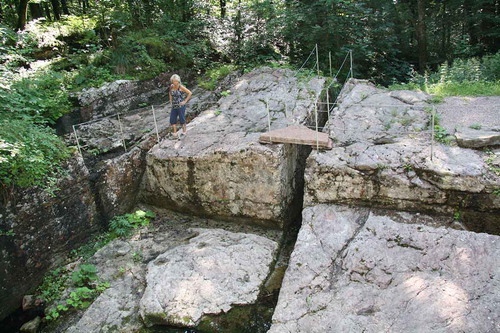
Figure 11. Sample questionnaire.
Figure 12. Associating of the word quarry – Poland.
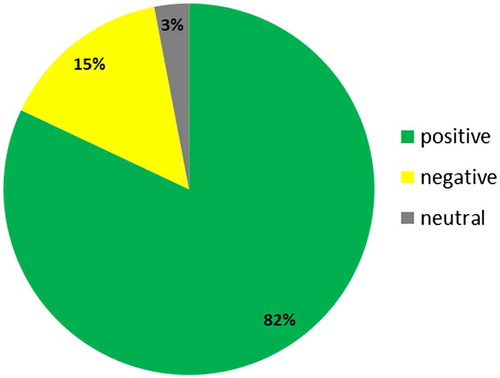
Figure 13. Associating of the word quarry – Great Britain.
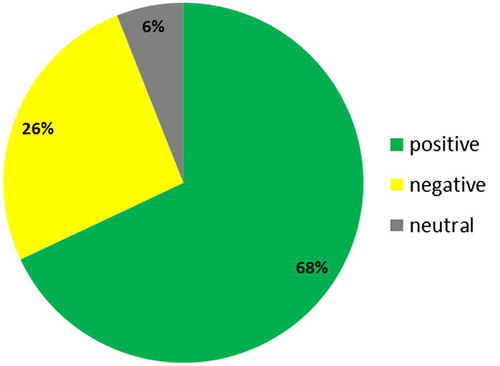
Figure 14. Associating of the word quarry – Austria.
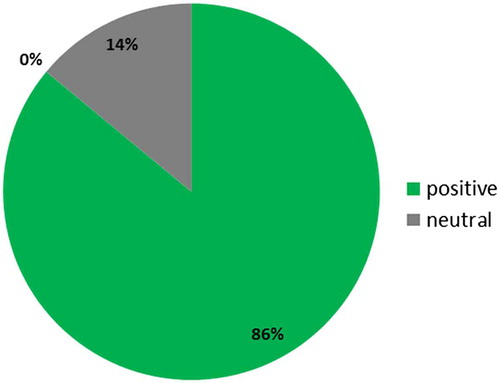
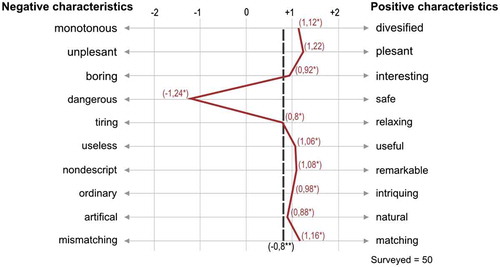
Figure 15. Polarised profiles of the evaluative characteristics of the quarry No. 2.
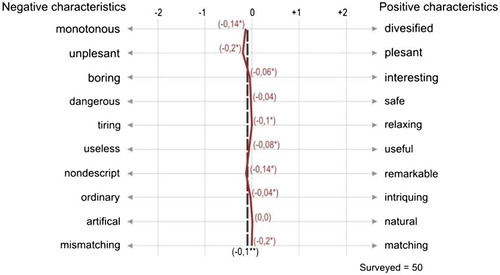
Figure 16. Polarised profiles of the evaluative characteristics of the quarry No. 11.
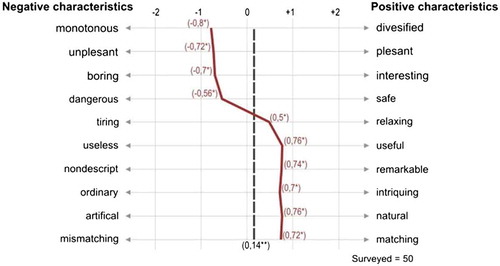
Figure 17. Polarised profiles of the evaluative characteristics of the quarry No. 16.