
Figures & data
Figure 1. Overview of the methodology applied in the CUSA project – Phase 1 [Citation1].
![Figure 1. Overview of the methodology applied in the CUSA project – Phase 1 [Citation1].](/cms/asset/1f886129-b3fa-4c24-a910-0b448f2224cc/nsme_a_2124786_f0001_oc.jpg)
Table 1. Mineral resource-related indicators initially identified in CUSA project (source [Citation1].
Table 2. Distribution of mining properties across the Strategic Corridors.
Figure 2. The initially identified 55 Corridors and the final envisaged 11 Strategic Corridors, as emerged from the CUSA project (source [Citation1]).
![Figure 2. The initially identified 55 Corridors and the final envisaged 11 Strategic Corridors, as emerged from the CUSA project (source [Citation1]).](/cms/asset/a8b2359e-0857-4628-9f11-e089efe73074/nsme_a_2124786_f0002_oc.jpg)
Figure 3. Number of mining properties located in Strategic corridors, by production stage and type.
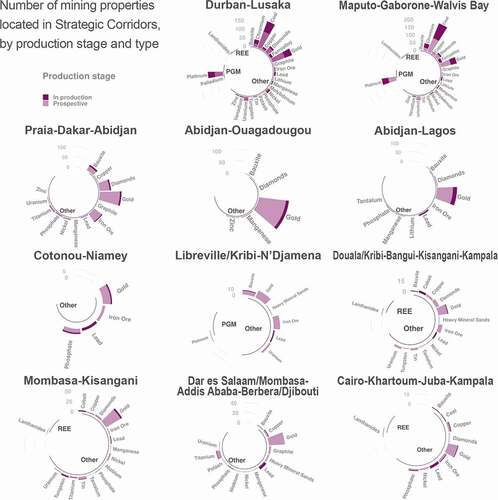
Table 3. Number of mining properties distributed across corridors (source: elaboration from S&P Global data).
Figure 4. Strategic Corridors and mining resources in Africa.
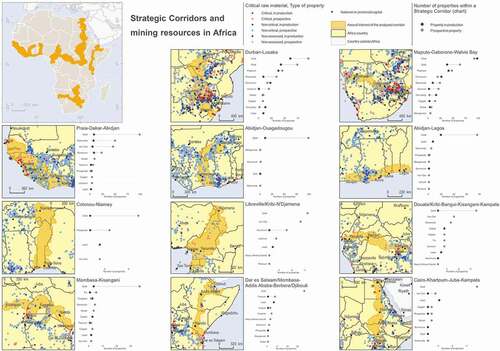
Figure 5. Mining properties classified by production stage and availability of battery materials: Durban-Lusaka.
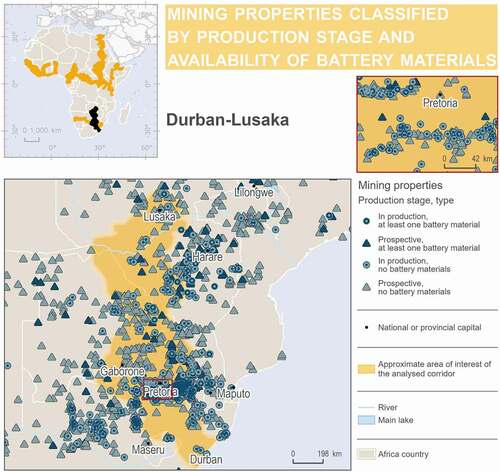
Figure 6. Mining properties classified by production stage and availability of battery materials: Maputo-Gaborone-Walvis Bay.
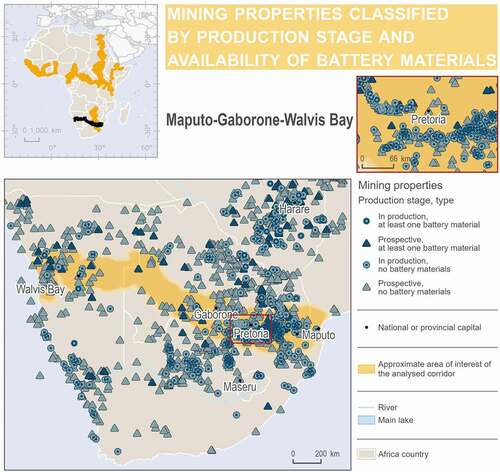
Figure 7. Mining properties classified by production stage and availability of battery materials: Cotonou-Niamey.
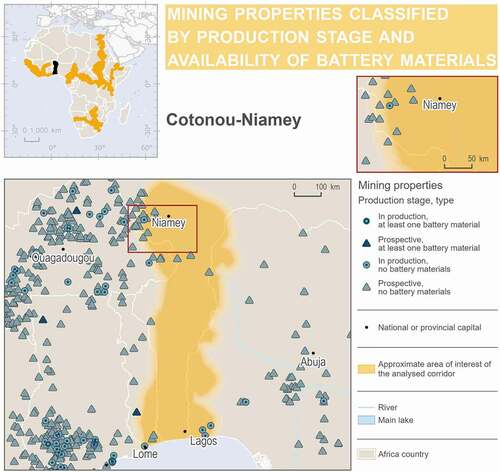
Table 4. Distribution of mining properties across African regions and Strategic Corridors (source: elaboration from S&P Global data).