
Figures & data
Figure 1. Point cloud of original (a) smooth, (b) intermediate, (c) rough surfaces. Different colours represent the surface elevations; blue is the lowest location, and red is the highest part of the surface.
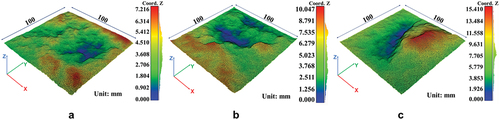
Figure 2. (a) Smooth, (b) intermediate, (c) rough surface specimens.
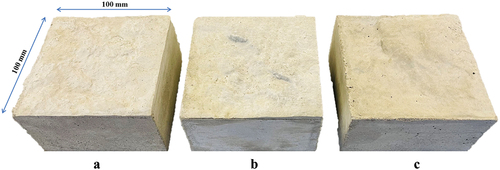
Figure 3. Setup of (a) structured light 3D scanner, (b) iPhone 12 Pro Max, (c) terrestrial LiDAR scanner.
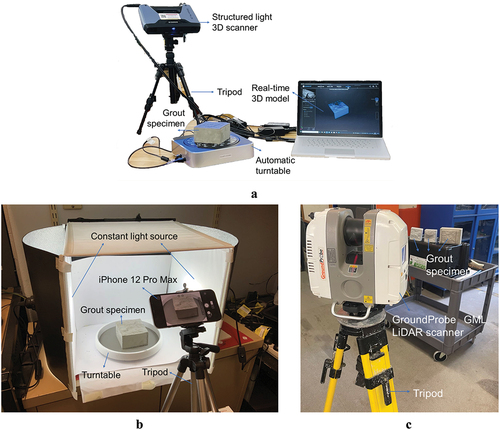
Table 1. The specifications of the structured light 3D scanner.
Figure 4. Profiles selected on the smooth surface with a sampling interval of 0.1 mm, (a) X direction, (b) Y direction, (c) different directions were selected at the interval of 15°.
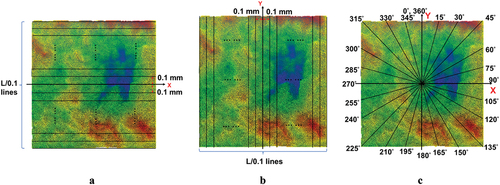
Figure 5. The reconstructed 3D surfaces from (a) structured light 3D scanner, (b) portable device photogrammetry, (c) terrestrial LiDAR scanner.
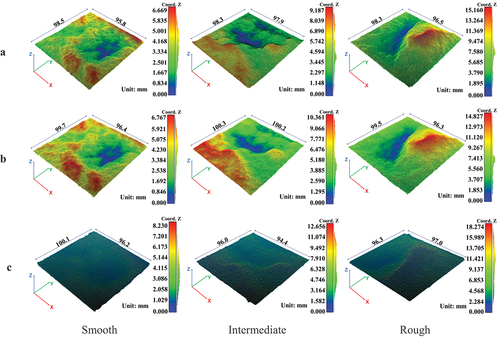
Table 2. Information of reconstructed 3D surface models.
Figure 6. The distance distribution from generated grid points to the interpolated (a) smooth, (b) intermediate, (c) rough surface (relative height).
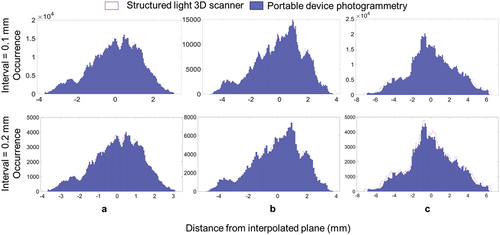
Figure 7. Distribution and occurrence of the cloud-to-cloud distance of the point clouds, (a) smooth, (b) intermediate, (c) rough surface.
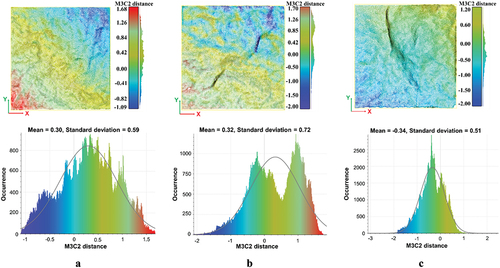
Table 3. The cloud-to-cloud distance between the structured light 3D scanner model and the portable device photogrammetry model.
Figure 8. Comparison of the line profiles from the structured light 3D scanner and portable device photogrammetry images at the surface centre along the X-axis. a smooth, b intermediate, and c rough surface.
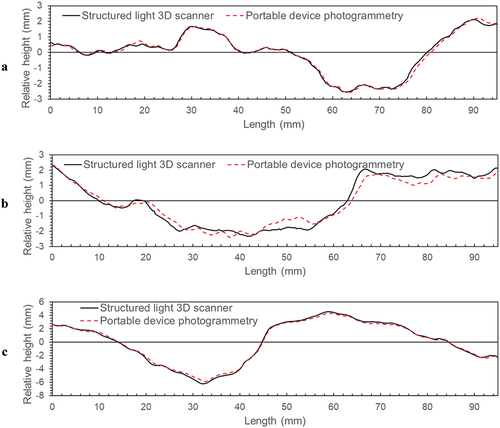
Figure 9. Anisotropic distribution of average JRC values for (a) smooth, (b) intermediate, and (c) rough surface.
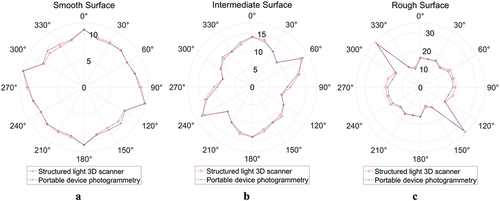
Table 4. Comparison of JRC values for different surfaces.
Figure 10. Distribution of 3D roughness parameter for a smooth, b intermediate, and c rough surface.
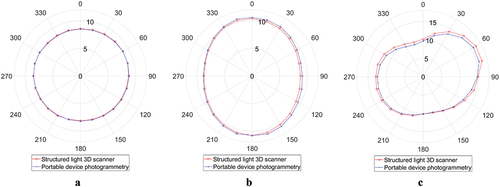
Table 5. Comparison of 3D roughness parameter .