Figures & data
Figure 1. Latest lateral transfer assist robot. a) Oblique front view of the lateral transfer assist robot (LTAR). The joystick is placed in the armrest on the left side and can be placed on the right side depending on the user’s preference. b) The preparatory state of the LTAR before transfer. When the armrest covers are closed on the transfer side prior to the transfer, the height of the seat and armrest increase or decreases until it is at the same height as the transfer surfaces. At the same time, the footrest moves down to lie flat at the floor level.
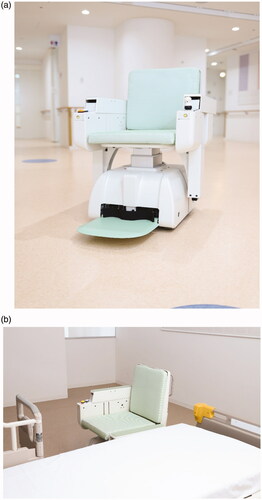
Figure 2. Functional Independence Measure (FIM) transfer scores for the wheelchair (WC) and lateral transfer assist robot (LTAR). The figure shows the difference in the FIM transfer scores of each participant (line plot) and for all participant (boxplot). The central lines of the boxplot represent medians; the box limits comprise the interquartile range from 25% and 75%. The boxplot whiskers extend to 1.5 times the interquartile range from the first and third quartiles.
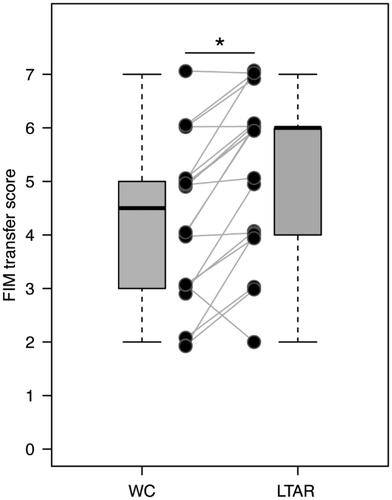
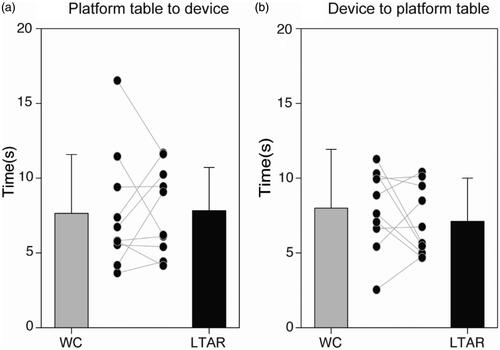
Figure 3. Transfer performance time. A boxplot shows the mean transfer performance time: a) from the platform table to the wheelchair (WC) or to the lateral transfer assist robot (LTAR), and b) from the WC or LTAR to the platform table. The vertical axis shows time in seconds. The solid line-plot represents the performance time of transfers for each patient.