Figures & data
Figure 1. RR free body diagram where Ft is the tangential force, V is the angular velocity and W is the load on the axle, FRR is the RR force, MZFT is the moment due to the tangential force, MZFRR is the moment inducing the RR force.
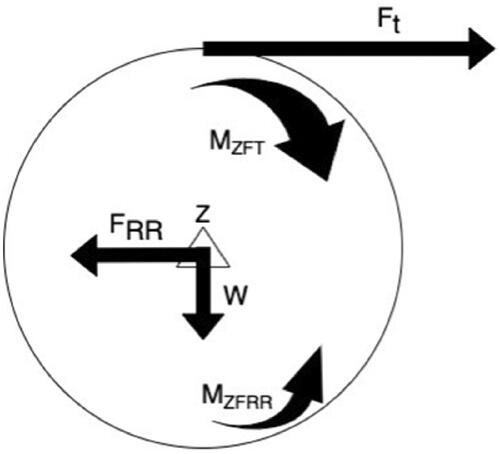
Figure 2. RR force versus toe angle for rear wheels.
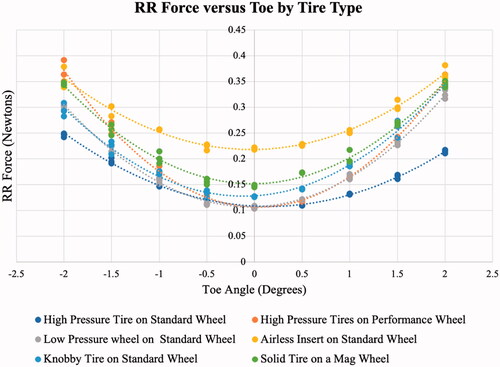
Figure 3. Toe angle free body diagram, V is velocity, Ft is the tangential force, Ftx is the tangential component in the x direction, Fty is the tangential component in the y direction.
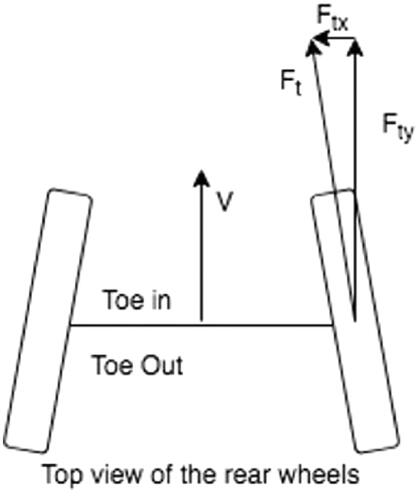
Table 1. Design specifications.
Table 2. Manual wheelchair community-based study recruitment.
Table 3. Manual wheelchair community-based study manufacturers.
Table 4. Manual wheelchair community-based study K codes.
Table 5. Manual wheelchair community-based study age.
Table 6. Manual wheelchair community-based study use data.
Table 7. Manual wheelchair community-based study tire types.
Table 8. Manual wheelchair community-based study tire manufacturers.
Table 9. Manual wheelchair community-based study wheel diameter.
Table 10. Manual wheelchair community-based study wheel type.
Figure 4. Toe angle and slop prevalence in the community.
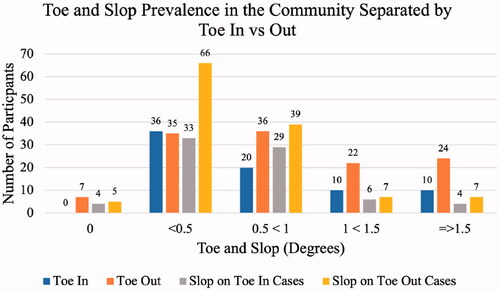
Figure 5. Tire manufacturer versus slop.
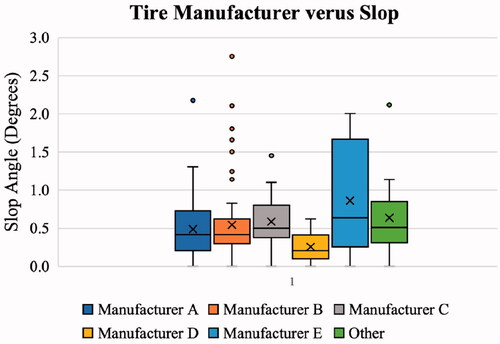
Table 11. Slop across each tire manufacturer.
Figure 6. Wheel diameter versus slop.
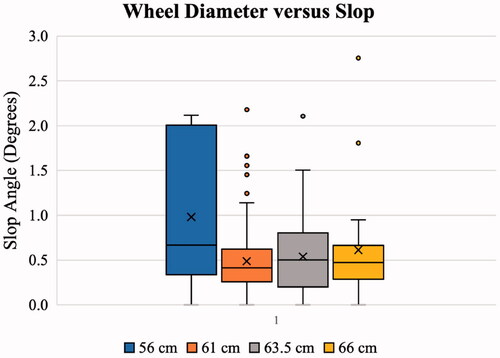
Table 12. Wheel diameter versus slop.
Table 13. Average results from the community-based study.
Table A1. Device information to be collected.
Figure A1. Measurement Device in Operation. Arrow represents applied force from force spring.
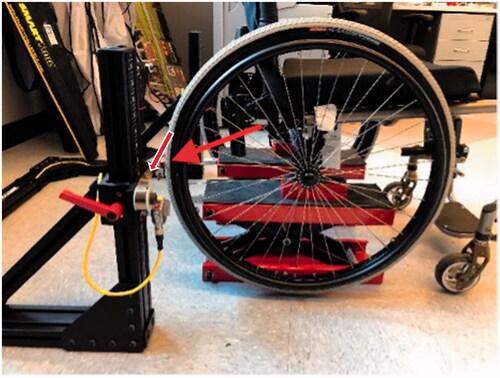
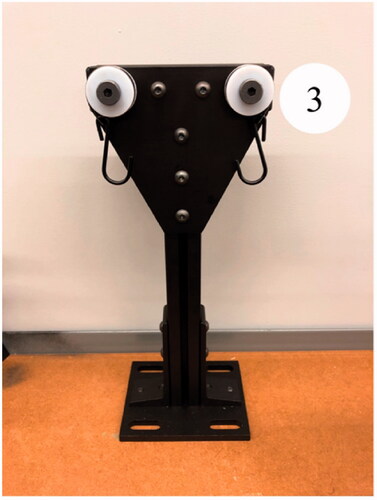
Figure B1. Laser measurement frame. (1) Frame, (2) linear slide, (3) spring with hook, (4) laser.
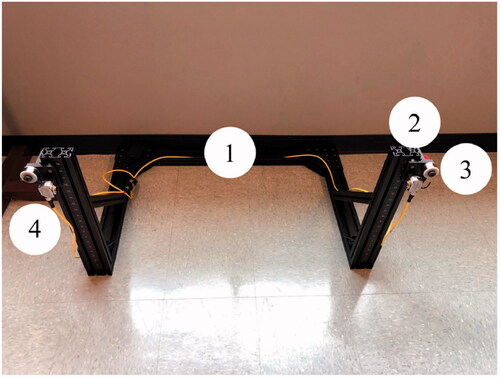
Figure B2. Rear View of Slop Measurements (3) Spring with Hook, (5) Jack.
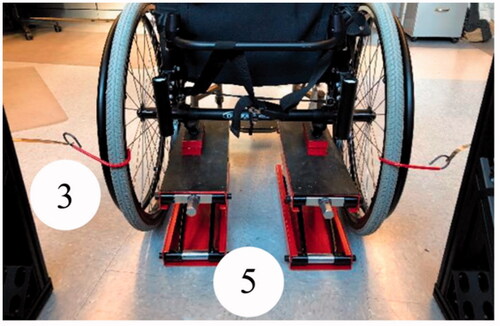
Figure B3. Toe-out Slop Tensioner. (3) Spring with Hook.