
Figures & data
Figure 1. Representative screenshots of the animation videos used in the questionnaire. Three illustrative screenshots of the videos used to explain the concept of BCIs, BCI-based communication and mental strategies that can be used to control the BCI. For simplicity and consistency across mental strategies, we used a spelling matrix as a control application (middle panel) and a button press (and subsequent letter selection) as a control output (upper panel).
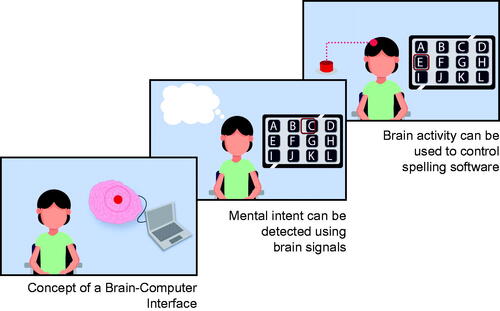
Figure 2. Demographic description of the users, caregivers and researchers. Demographic information of the users (N = 28), caregivers (N = 29) and researchers (N = 29) included in this study was extracted from Section 1 of the questionnaire. (A) Information (in percentage) about the user’s gender (male, female), age group (50 years old, >50 years old), living situation (at home or at a nursing home), aetiology (neuromuscular disease, NMD; sudden onset, SO) and whether they were naïve to BCI. (B) Information (in percentage) about the caregiver’s gender (male, female), age group (
50 years old, >50 years old), personal/professional relation to the user (family member, professional caregiver), type of LIS of individual the caregiver takes care of (neuromuscular disease, NMD; sudden onset, SO), and whether they were naïve to BCI. (C) Information (in percentage) about the researcher’s gender (male, female), age group (
50 years old, >50 years old), continent of residence (Asia, Europe or North America), and whether they worked with individuals with locked-in syndrome (LIS) and communication Brain-Computer Interfaces (cBCIs). Bar plots indicate most used signal acquisition techniques by researchers in their line of work, as well as the most investigated mental strategies for controlling a BCI.
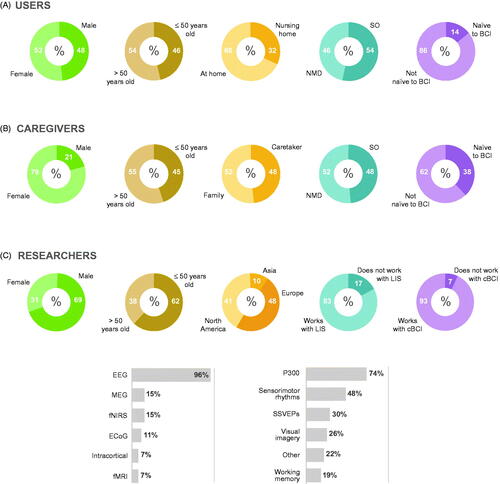
Figure 3. Comparison between users’ current AT application and expected cBCI applications. (A) Ranking of preferred applications to be supported by a cBCI, using the centre-of-mass (COM) metric. Meaningful differences between groups were estimated using the Monte Carlo variance indicated on the top right corner (0.32). In addition, the size of the Monte Carlo variance is indicated on top of the one bar that showed a larger-than-Monte-Carlo-variance difference from users. Rating scales ranged from 1 (least preferred) to 6 (most preferred). (B) Percent of users that have a specific AT application currently available at home (dark green, highlighted with black line) compared with the importance of these applications as rated by the caregivers (green) and researchers (light green). (C) Median and median absolute deviation (error bars) of how often each application was (estimated to be) used. Of note, the frequency of usage of each application was computed from the number of participants that selected that specific application in B (grey bars; units in the right-side y-axis; copies of the information given in B).
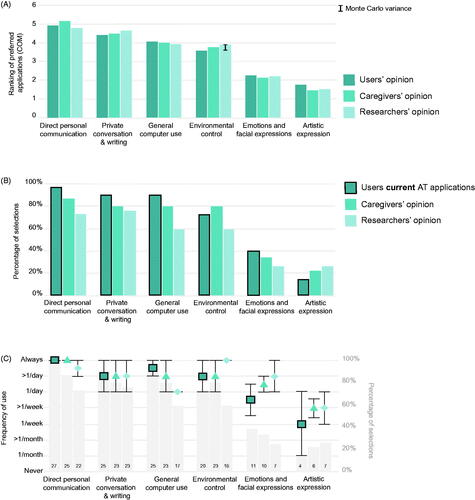
Figure 4. Comparison between users’, caregivers’ and researchers’ opinion about mental strategies. (A) Centre-of-mass (COM) values computed for the top 4 mental strategies for users, caregivers and researchers. Note that caregivers rank their preference from their own perspective (as an abled control group), whereas researchers ranked from the perspective of the users. Monte Carlo variance is indicated on the top right corner of each panel and at each caregiver/research bar of which the difference with the user bar is larger or smaller than the Monte Carlo variance (0.28). Ranking scales ranged from 1 (least preferred) to 4 (most preferred). (B–C) Percent of participants that rated each strategy (in a 5-points Likert scale) according to how easy (B) and how enjoyable (C) it is. The charts position the % of replies vertically such that positive responses are stacked above the horizontal baseline (0%) and negative responses are stacked below the baseline. The ‘neutral’ is centred around 0%. Mental strategies highlighted in grey showed a statistically significant difference between groups (Kruskal Wallis test, p < 0.05, Bonferroni corrected for 8 repetitions). For the strategies with significant difference between groups, pair-wise Mann-Whitney tests were used to test which groups were statistically different between users and researchers or caregivers (* < 0.05).
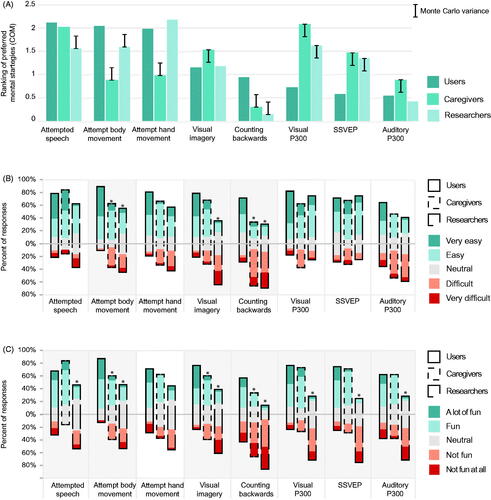
Figure 5. Results of time of AT information ratings. Opinion of participants (in percentage) per group (users, caregivers and researchers) about the timing of information delivery on AT and cBCIs for people with LIS due to neuromuscular disorder (A: NMD) or sudden onset (B: SO).
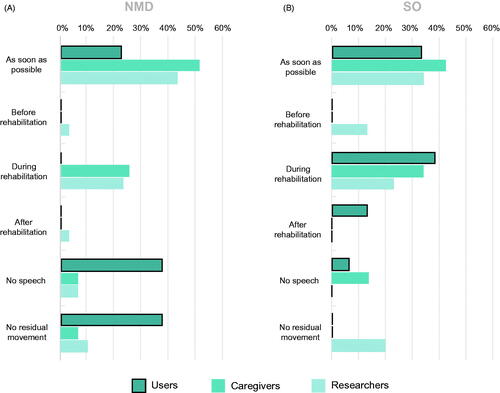
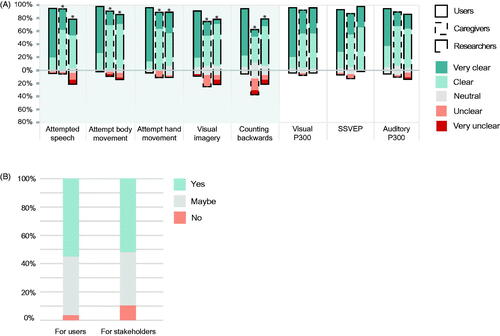
Figure 6. Animation videos feedback from users, caregivers and researchers. (A) The three respondent groups (users, caregiver and researchers) rated the animation videos introducing each mental strategy according to how clear it was, using a 5-points Likert scale. Videos on mental strategies highlighted in grey showed a statistically significant difference between groups (Kruskal Wallis test, p < 0.05, Bonferroni corrected for 8 repetitions). For the strategies with a significant difference between groups, pair-wise Mann-Whitney tests were used to test which groups (caregivers/researchers) were statistically different from the users (* < 0.05). (B) Percent of researchers that reported that the animation videos were a clear (or not) means to introduce cBCIs and mental strategies to user and other stakeholders (Yes = clear; No = not clear).
Questionnaire_researchers_V1.pdf
Download PDF (2.3 MB)Data availability statement
The animation videos used in the questionnaires (Video 1–9; translated to English) are available at https://doi.org/10.5281/zenodo.3271440. The BCI researchers’ questionnaire (in English) is available in Supplementary Materials. The Users’ and Caregivers’ questionnaires (Dutch only) and data that support the findings can be made available upon reasonable request to the authors.