Figures & data
Table 1. Summary of demographic information by setting and role (N = 91).
Table 2. Summary of demographic information by years in service delivery and role (N = 91).
Table 3. Summary of each component of wheelchair skills taught reported by health professionals showing frequency of occurrence and percentages of responses.
Table 4. Detailed breakdown of the percentages of reported confidence instructing basic mobility skills by health professional’s position.
Table 5. Detailed breakdown of the percentages of reported confidence instructing advanced mobility skills by health professional’s position.
Table 6. Summary of health professionals’ reported confidence instructing each component of wheelchair skills taught showing percentages of responses.
Figure 1. Detailed breakdown of the reported number of wheelchair skills training sessions completed with users by health professionals showing frequencies of responses.
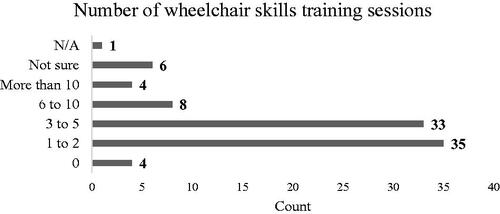
Figure 2. Detailed breakdown of the reported number of hours spent completing wheelchair skills training with users by health professionals showing frequencies of responses.
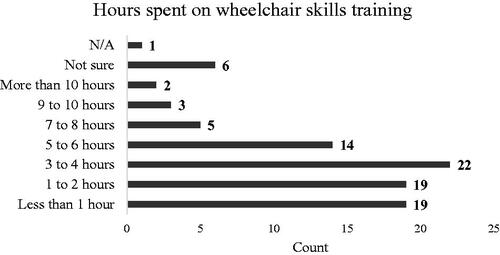
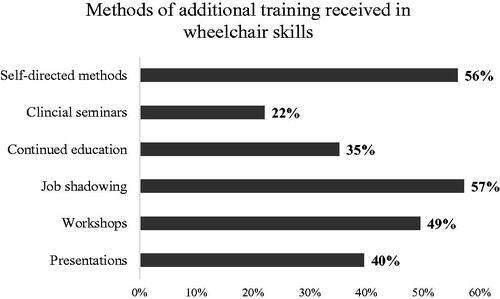
Figure 3. Detailed breakdown of percentages of additional training methods (outside of their professional training) health professionals used to obtain knowledge in wheelchair skills.