
Figures & data
Figure 1. PRISMA flow diagram.
Image of the PRISMA flow diagram showing the number of records found at the identification and screening phases, and ultimately the total number included.
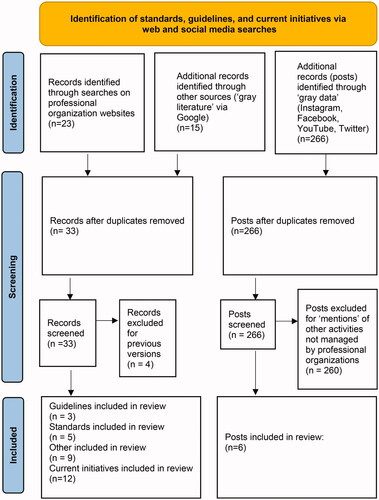
Table 1. Shows the number of posts related to wheelchair service provision by each organisation since the initiation of that particular social media account.
Figure 2. Perpetuating and attenuating factors related to inadequate wheelchair education.
Image of a graph demonstrating the main attenuating (including advocacy, peer support, and existing resources) and perpetuating factors (including limited awareness, support, and resources) of inadequate wheelchair service provision.
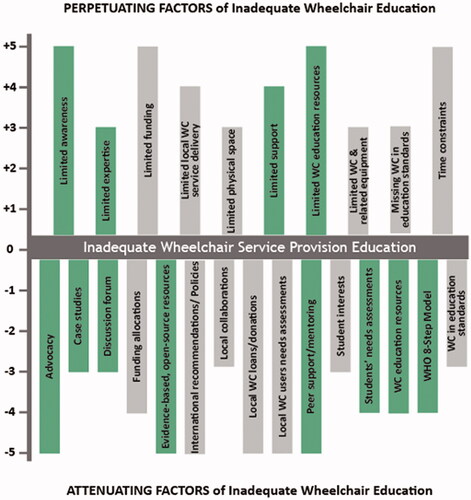
Table 2. States of wheelchair integration into University Curricula.