
Figures & data
Figure 1. Schematic overview of the study protocol.
Body composition measurements and questionnaires were administered in the week prior to and the week after the 12-week intervention. Nutrition diaries were collected during the first week and in the week after the 12-week intervention. Fitbit data were continuously collected from 1 week prior until the end of the 12-week intervention period.
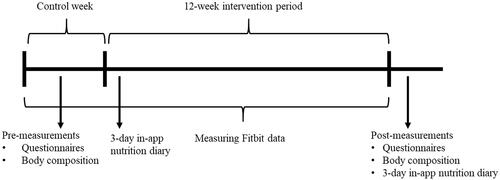
Figure 2. Flow chart of participant’s inclusion.
45 individuals showed interest in participating in the study, of which one withdrawn and 11 were excluded based on inclusion- and exclusion criteria. Of the 33 individuals included in the study, three dropped out, resulting in 30 individuals finishing the 12-week intervention period.
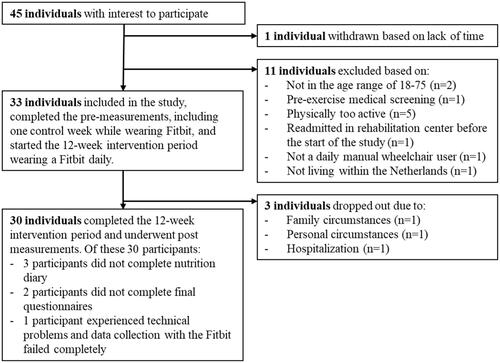
Table 1. Demographic characteristics of the participants.
Table 2. Experienced stage of change on nutrition and physical activity pre and post intervention (n = 28).
Table 3. Regression analyses on Fitbit data.
Table 4. Nutritional intake pre and post 12-week intervention based on diet records (n = 26).
Table 5. Body composition changes pre and post 12-week intervention (n = 27).
Table 6. Results from questionnaires pre and post 12-week intervention (n = 28).