
Figures & data
Table 1. Ergonomics of human–system interaction.
Table 2. Participant demographics.
Table 3. Tasks tested during user testing.
Figure 1. Participant behaviour observation grid and task completion activities.
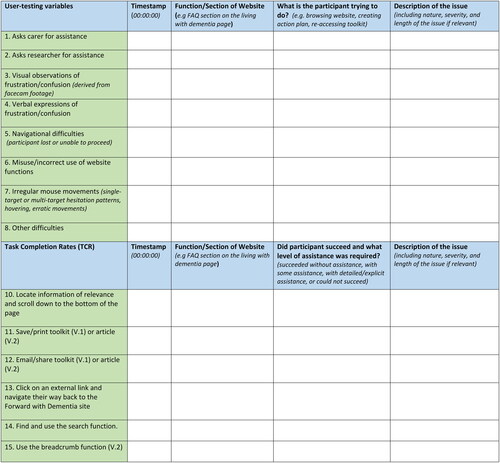
Table 4. Characteristics relating to user experience and usefulness of website content including information, images, language and terminology (participant interview responses are quoted and italicized).
Table 5. Characteristics of website functionality including search, scroll up/down arrow, breadcrumbs, print, email and toolkit functions (participant interview responses are quoted and italicized).
Table 6. Characteristics of website navigation between and within pages of the website (participant interview responses are quoted and italicized).
Table 7. Characteristics around website legibility such as visual design and typography (participant interview responses are quoted and italicized).
Figure 2. Side-by-side comparison of V.1 (left) and V.2 (right).
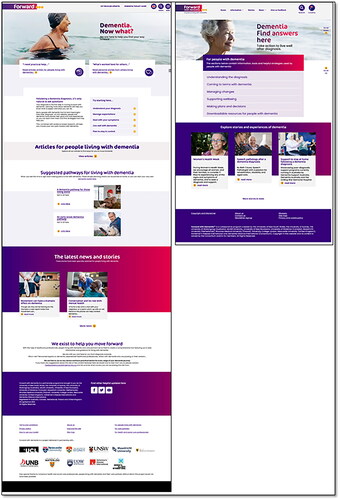
Figure 3. Simplified System Usability Scale scores.
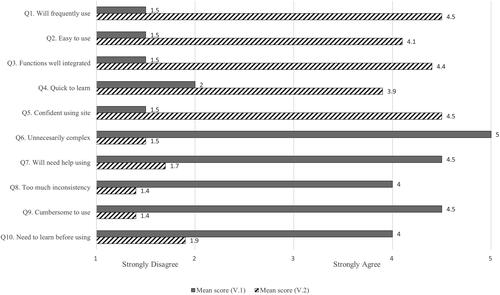
Table 8. Task Completion Rates.
Table 9. Key considerations for designing digital applications for people with dementia and family carers.
Data availability statement
Data are not available due to ethical reasons.