
Figures & data
Table 1. Key definitions of assistive technology.
Figure 1. Unmet and under-meet needs among the most-needed assistive products.
A horizontal histogram showing what proportion of need was unmet or under-met, for the most-needed assistive products. Sixteen products are listed. Walking sticks and canes have the least amount of unmet need (<5%), while furnishings and fixtures for supporting have almost 90% unmet need. Spinal and cranial orthoses have relatively low unmet need (around 5%) but the highest amount of under-met need, around 45%.
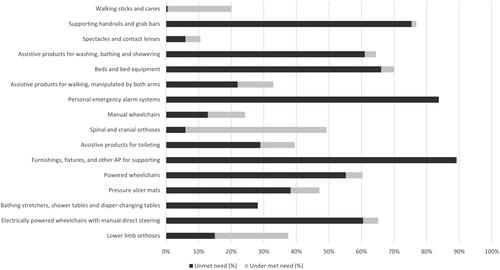
Table 2. Indicators for most-needed APs.
Figure 2. AP Adoption process.
The steps in the process of adopting assistive technology. Ideally, a user is first aware of the AT, then reports need (or no need) for AT, then has AT, then uses AT, and then is satisfied with AT. If the user is unaware, they do not consider their need for AT and may have unmet need. If they need but do not have AT, there is also an unmet need. If they have but do not use AT, or if they use but are unsatisfied with AT, there is under-met need.
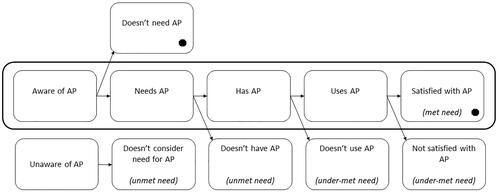
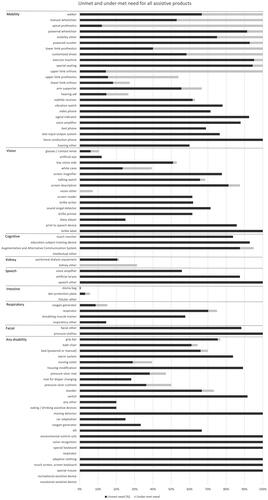
Figure A1. Unmet and under-meet need for all assistive products similar to , this horizontal histogram shows the proportion of need that is unmet or under-met for all included assistive products in the National Disability Survey, of which there are 77.
Data availability statement
All data utilized in this case study are available, either publicly or by request, through national statistics office websites of the Korean government.