
Figures & data
Figure 1. Study flow diagram.
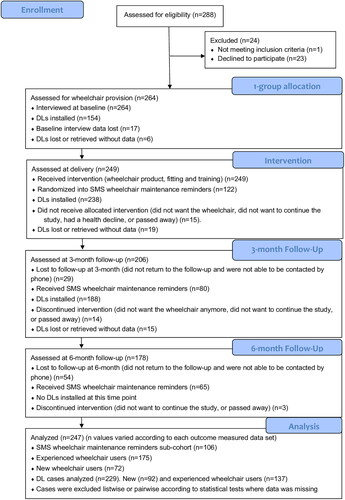
Figure 2. Study wheelchairs. From left to right: a) standard, b) active, and c) all-terrain wheelchairs.
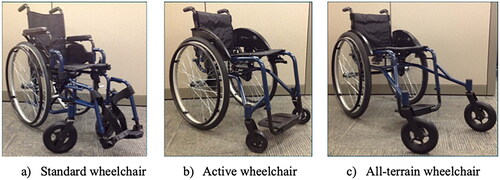
Table 1. Questionnaires administered by study visit and participant type.
Table 2. Demographic and clinical data.
Table 3. Demographic data at baseline for caregivers.
Table 4. Wheelchair-related health indicators over time, n (%).
Table 5. Mean (SD) quality of life scores by time as measured with WHO QOL-Bref (n = 164).
Table 6. Median (IQR) total percentage WST-Q capacity scores by time and by wheelchair ownership at baseline.
Table 7. Wheelchair use measurements by time, median (IQR).
Table 8. Number (%) of participants who did wheelchair repairs and who experienced adverse events by time and by wheelchair ownership at baseline.
Table 9. Burden of care indicators for caregivers over time, median (IQR).
Table 10. Mean (SD) poverty probabilities by time (n = 162).
Data availability statement
All data files of this study are publicly available from the OPEN-ICPSR (Inter-university Consortium for Political and Social Research) database at https://doi.org/10.3886/E173201V1.