
Figures & data
Table 1. Description of the five VR applications (in order) in which participants were immersed.
Figure 1. Observed directions that participants viewed to orient within the virtual space.
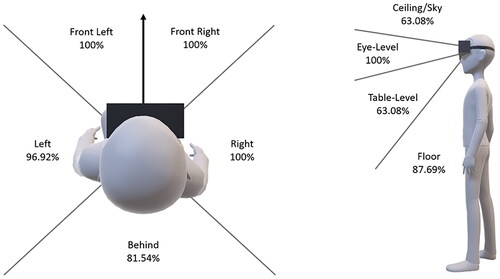
Figure 2. Observed regions where participants reached for and/or grasped virtual objects.
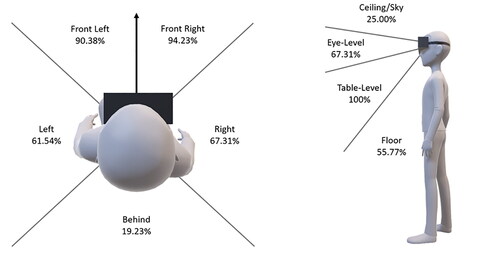
Table 2. Proportion of participants and virtual experiences where depth perception errors were observed in reaching behaviours.
Table 3. Instances of unconventional behaviour observed with characters in virtual interactions.
Table 4. Type of support required while immersed in virtual reality.
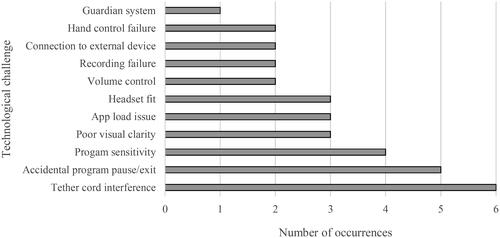
Figure 3. Technological challenges experienced by users while using immersive virtual reality.
Supplemental Material
Download PDF (299.7 KB)Data availability statement
The data associated with this research is not available due to ethical constraints.