Figures & data
Table 1. Demographics of respondents (n = 122).
Table 2. Typical wheelchair usage of respondents and weight of current wheelchair (n = 122).
Figure 1. Number of responses to questions about respondent’s current wheelchair. Questions related to the fitting, the reasons for choosing their wheelchair and users overall satisfaction with their wheelchair. Unless stated otherwise in the figure, all respondents (n = 122) answered each question. Respondents could select multiple responses for the question: reasons for choice of wheelchair.
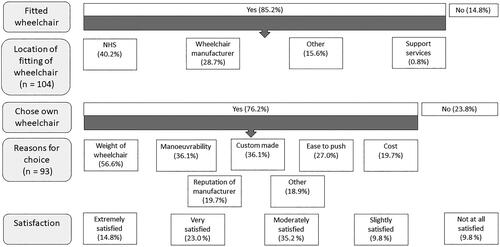
Table 3. Design improvements suggested by respondents.
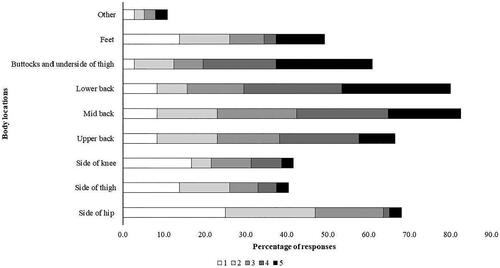
Figure 2. Regions of discomfort at different body locations and severity of the discomfort. Respondents were asked to rank the severity of the discomfort at each region, 1 = little discomfort, 5 = maximum discomfort.