
Figures & data
Figure 1. An overview of mechanical power balance based on van der woude et al. [Citation8] and van Inge Schenau and Cavangh [Citation9]. frictional power (Pdrag) consists of rolling resistance (Proll), internal friction (Pint), air resistance (Pair) and losses due to inclination (Pincl). Frictional power can be determined with a coast-down or drag test. The type of frame not only influences frictional power but also has the potential to impact internal power loss (Ploss), particularly through factors such as frame deformation, which occurs exclusively during propulsion. The difference between Pdrag and Pout determines displacement, velocity and acceleration.
![Figure 1. An overview of mechanical power balance based on van der woude et al. [Citation8] and van Inge Schenau and Cavangh [Citation9]. frictional power (Pdrag) consists of rolling resistance (Proll), internal friction (Pint), air resistance (Pair) and losses due to inclination (Pincl). Frictional power can be determined with a coast-down or drag test. The type of frame not only influences frictional power but also has the potential to impact internal power loss (Ploss), particularly through factors such as frame deformation, which occurs exclusively during propulsion. The difference between Pdrag and Pout determines displacement, velocity and acceleration.](/cms/asset/3a48c784-5c79-47b5-8db6-3edd73ced3d8/iidt_a_2365270_f0001_c.jpg)
Table 1. Wheelchair frame types.
Table 2. Wheelchair characteristics after standardization.
Figure 2. The study protocol at both locations: Amsterdam (A) and Groningen (G). The practice period took approximately 5 min per wheelchair. The submaximal test, conducted on an ergometer or treadmill, consisted of 4-min of continuous propulsion.
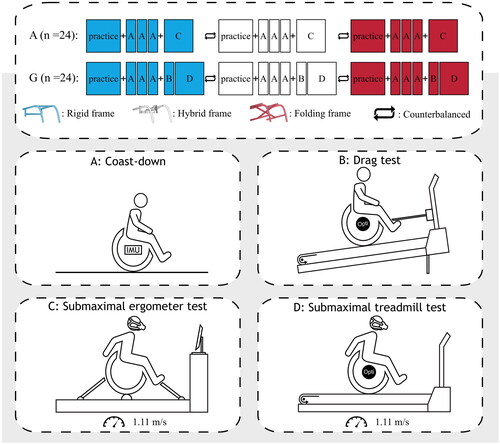
Table 3. Propulsion technique variables.
Figure 3. Boxplots present data with median and interquartile range. A & B: Rolling resistance, C: power output, D: Mean force per push, E: Push frequency, F: contact angle, G: Energy expenditure (EE) and H: Net mechanical efficiency (NME). All measures were significantly impacted by the wheelchair frames (p < 0.05). Outliers are denoted as (o). Significant post-hoc test (LSD) results are depicted as ([![]()
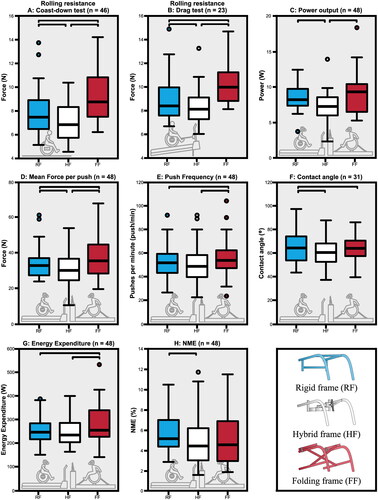
Table 4. Results of the repeated measures ANOVA for the propulsion technique variables of both the treadmill and wheelchair ergometer submaximal test (n = 48).
Data availability statement
Data is available on reasonable request.