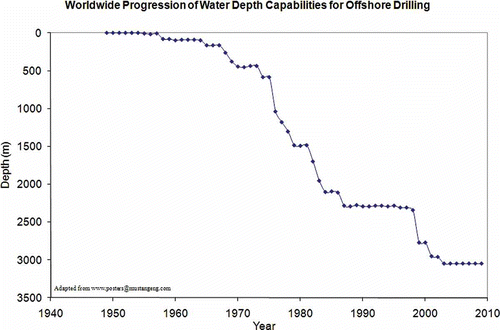
9,288
Views
30
CrossRef citations to date
0
Altmetric
Original Articles

The Fourth James K. Mitchell Lecture: The CPT in offshore soil investigations - a historic perspective

Pages 75-101 | Received 17 Jan 2011, Accepted 07 Oct 2011, Published online: 07 Mar 2012

Figures & data

Figure 1. Worldwide progression of water depth for offshore drilling (adapted from [email protected]).

Figure 1. Worldwide progression of water depth for offshore drilling (adapted from www.posters@mustangeng.com).

Figure 2. Fugro's Seabull rig (courtesy of Fugro).

Figure 2. Fugro's Seabull rig (courtesy of Fugro).

Figure 3. Fugro's Seacalf rig (from Zuidberg Citation1974).

Figure 3. Fugro's Seacalf rig (from Zuidberg Citation1974).

Figure 4. NGI/McClelland's CPT operation at Ekofisk (from Eide Citation1974).

Figure 4. NGI/McClelland's CPT operation at Ekofisk (from Eide Citation1974).

Figure 5. McClelland's Stingray rig (from McClelland Citation1975).

Figure 5. McClelland's Stingray rig (from McClelland Citation1975).

Figure 6. Diving bell operated by Delft Soil Mechanics Laboratory (from Vermeiden Citation1977).

Figure 6. Diving bell operated by Delft Soil Mechanics Laboratory (from Vermeiden Citation1977).

Figure 7. APvdBerg's ROSON rig (courtesy APvdBerg) (a) Heavy weight version (b) Principle of ROSON.

Figure 7. APvdBerg's ROSON rig (courtesy APvdBerg) (a) Heavy weight version (b) Principle of ROSON.

Figure 8. Fugro/McClelland's TSP rig (from Power & Geise Citation1994).

Figure 8. Fugro/McClelland's TSP rig (from Power & Geise Citation1994).

Figure 9. IFREMER's Penfield rig (copyright IFREMER).

Figure 9. IFREMER's Penfield rig (copyright IFREMER).

Figure 10. Benthic's PROD rig (courtesy of Benthic Geotech) (a) PROD on deck (b) Cone penetrometer with pushrod.

Figure 10. Benthic's PROD rig (courtesy of Benthic Geotech) (a) PROD on deck (b) Cone penetrometer with pushrod.

Figure 11. Geo's Geoceptor rig (courtesy of Geo).

Figure 11. Geo's Geoceptor rig (courtesy of Geo).

Figure 12. DATEM's Neptun 3000 rig (courtesy of DATEM).

Figure 12. DATEM's Neptun 3000 rig (courtesy of DATEM).

Figure 13. Fugro's Wison (after Zuidberg Citation1972).

Figure 13. Fugro's Wison (after Zuidberg Citation1972).

Figure 14. McClelland's Dolphin system (Peterson & Johnson Citation1985).

Figure 14. McClelland's Dolphin system (Peterson & Johnson Citation1985).

Figure 15. CPT while drilling, CPTWD (after Sachetto Citation2004) (a) principle (b) Picture.

Figure 15. CPT while drilling, CPTWD (after Sachetto Citation2004) (a) principle (b) Picture.

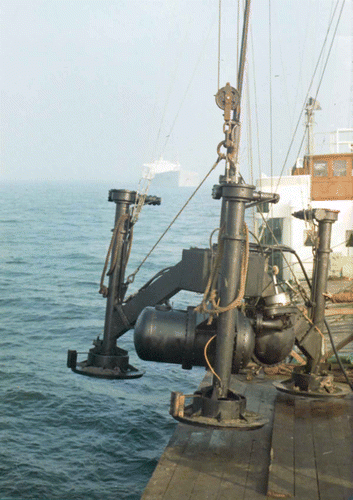
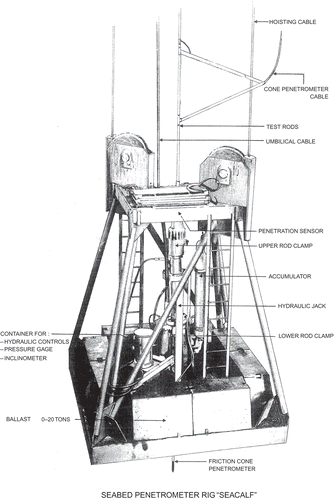
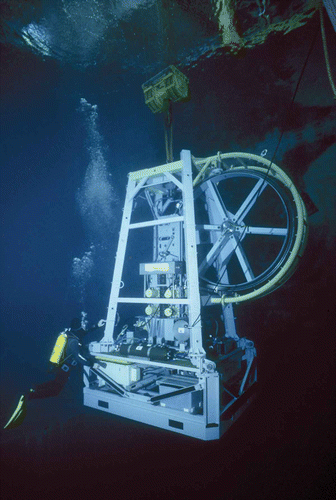
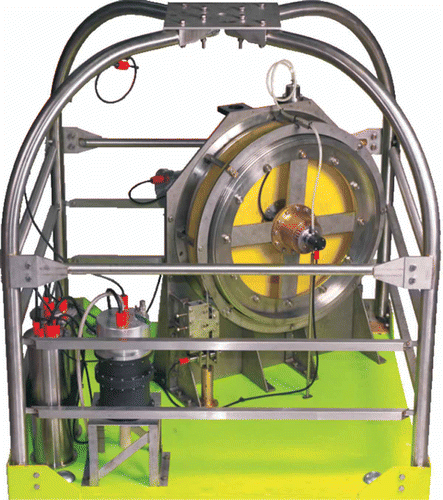
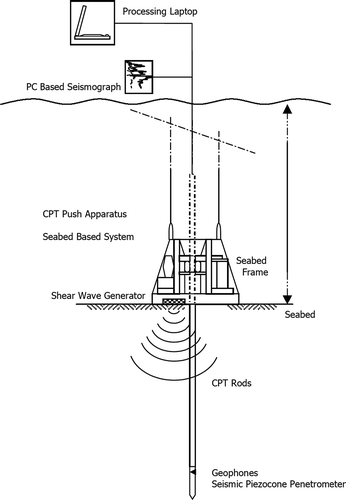
Table 1. Summary of the main developments for seabed rigs

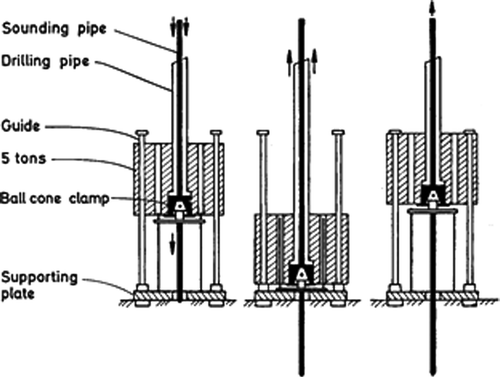
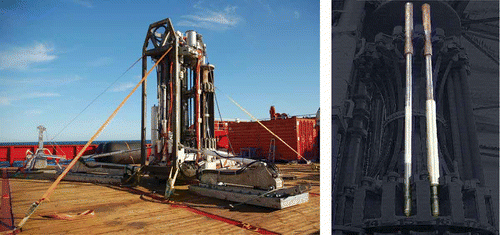
Table 2. Summary of the main developments of down-hole type CPTs

Figure 16. Fugro's 15 cm2 piezocone with pore pressure on cone face (after Zuidberg et al. Citation1982).

Figure 16. Fugro's 15 cm2 piezocone with pore pressure on cone face (after Zuidberg et al. Citation1982).

Figure 17. Compensated shear load cell design (from Bogess & Robertson Citation2010).

Figure 17. Compensated shear load cell design (from Bogess & Robertson Citation2010).

Figure 18. Results of CPTUs from four organizations at Onsøy.

Figure 18. Results of CPTUs from four organizations at Onsøy.

Figure 19. Examples of parallel CPTU by different companies (a) Norwegian Sea (b) Offshore Africa.

Figure 19. Examples of parallel CPTU by different companies (a) Norwegian Sea (b) Offshore Africa.

Figure 20. Unequal end area effects on friction sleeve.

Figure 20. Unequal end area effects on friction sleeve.

Figure 21. McClelland's triple element piezocone and special cones (from Bayne & Tjelta Citation1987).

Figure 21. McClelland's triple element piezocone and special cones (from Bayne & Tjelta Citation1987).

Figure 22. Results of triple element piezocone from Gullfaks C (from Bayne & Tjelta Citation1987).

Figure 22. Results of triple element piezocone from Gullfaks C (from Bayne & Tjelta Citation1987).

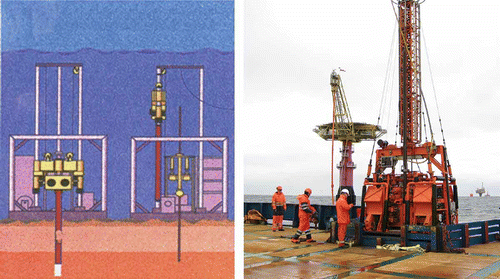
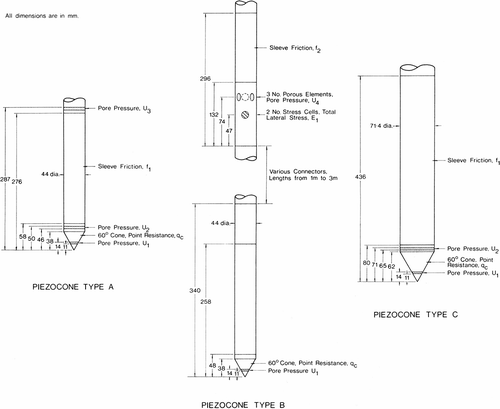
Table 3. Some CPTU add on devices that have been used offshore

Figure 23. Combined results of piezocone test and nuclear density test at Gullfaks C in the North Sea (from Tjelta et al. Citation1985).

Figure 23. Combined results of piezocone test and nuclear density test at Gullfaks C in the North Sea (from Tjelta et al. Citation1985).

Figure 24. Schematic layout for seabed seismic cone testing (from Peuchen et al. Citation2002).

Figure 24. Schematic layout for seabed seismic cone testing (from Peuchen et al. Citation2002).

Figure 25. Results of Gmax measurement (from Lange et al. Citation1990).

Figure 25. Results of Gmax measurement (from Lange et al. Citation1990).

Figure 26. CPT penetrometer, T-bar and ball.

Figure 26. CPT penetrometer, T-bar and ball.

Figure 27. Example of down-hole CPT with faulty zero readings.

Figure 27. Example of down-hole CPT with faulty zero readings.

Figure 28. Recommended scheme for reporting deck to deck readings for seabed CPTUs in new ISO standard.

Figure 28. Recommended scheme for reporting deck to deck readings for seabed CPTUs in new ISO standard.

Figure 29. Example CPTU profile for wind farm project.

Figure 29. Example CPTU profile for wind farm project.

Figure 30. Clay sites investigated by NGI and Fugro (Lunne et al. Citation1976).

Figure 30. Clay sites investigated by NGI and Fugro (Lunne et al. Citation1976).

Figure 31. Cone factors based on vane shear strength (Lunne et al. Citation1976).

Figure 31. Cone factors based on vane shear strength (Lunne et al. Citation1976).

Figure 32. Deepwater example with undrained shear strength interpreted from CPTU and CAUC triaxial tests.

Figure 32. Deepwater example with undrained shear strength interpreted from CPTU and CAUC triaxial tests.

Table 4. Recommended N-factors (adopted from Low et al. Citation2010)

Figure 33. Schmertmann's original qc, σvo', Dr chart (from Schmertmann Citation1971).

Figure 33. Schmertmann's original qc, σvo', Dr chart (from Schmertmann Citation1971).

Figure 34. Assessment of relative density in sandy layers from .

Figure 34. Assessment of relative density in sandy layers from Figure 30.

Figure 35. Correction of fine content for liquefaction analyses (adapted from Seed and de Alba Citation1986 and Stark and Olson Citation1995).

Figure 35. Correction of fine content for liquefaction analyses (adapted from Seed and de Alba Citation1986 and Stark and Olson Citation1995).

Reprints and Corporate Permissions

Please note: Selecting permissions does not provide access to the full text of the article, please see our help page How do I view content?

To request a reprint or corporate permissions for this article, please click on the relevant link below:

Academic Permissions

Please note: Selecting permissions does not provide access to the full text of the article, please see our help page How do I view content?

Obtain permissions instantly via Rightslink by clicking on the button below:

If you are unable to obtain permissions via Rightslink, please complete and submit this Permissions form. For more information, please visit our Permissions help page.