
Figures & data
Table 1. Number of services switching mode, all domains
Table 2. Number of services switching mode, physical domain
Table 3. Number of services switching mode, operational domain
Figure 1. Percentages of shifting trends (2010–2018)
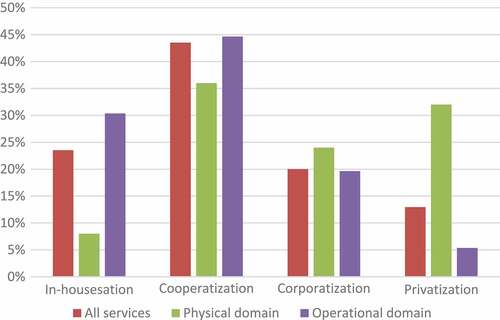
Figure 2. Percentages of reverse shifting trends (2010–2018)
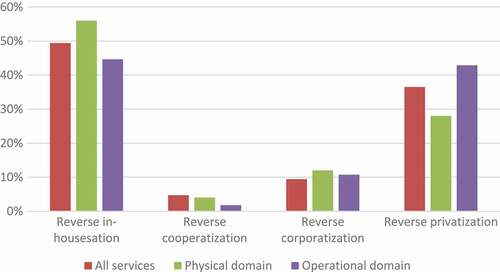
Table 4. Average asset specificity and measurement difficulty ratings
Table 5. Descriptive statistics
Table 6. Logistic regression analysis results