Figures & data
Figure 1. Distribution of state-ownership shares.This figure plots the non-parametric distribution (Epanechnikov Kernel) of state ownership for all banks in which state ownership is at least 1%. The top left panel includes all the banks included in the dataset used in this paper, the top right panel only uses data for banks based in advanced economies, and the bottom panels use data for banks based in middle-income (MIC) and low-income (LIC) economies.
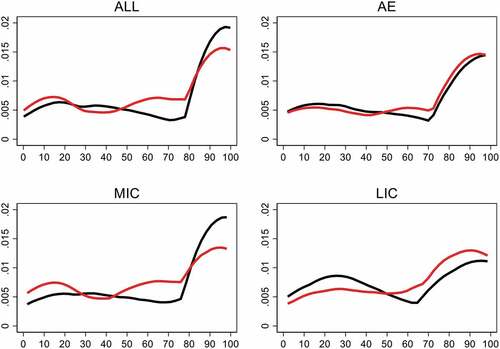
Figure 2. Share of state-owned banks.
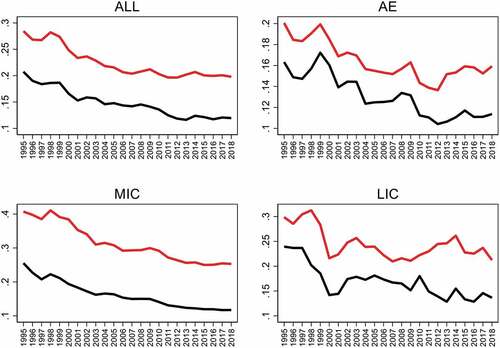
Table 1. State-owned banks and financial depth (dep. var: credit to the private sector).
Table 2. State-owned banks and GDP growth (dep. var: per capita GDP growth, 5-year average).
Table 3. State-owned banks and banking crises and logit model (dep. var: banking crisis dummy).
Table 4. Bank ownership and lending cyclicality (dep. var: growth of net loans).
Table 5. Bank ownership, lending cyclicality, and fiscal fundamentals (dep. var: growth of net loans).
Bank ownership and lending to the government (dep. var government bond holding over assets). The spikes are 95% (in black) and 99% (in grey) confidence intervals.