
Figures & data
Figure 1. There is a vast discrepancy between De Jure “rules” and the de facto “deals” outcomes.
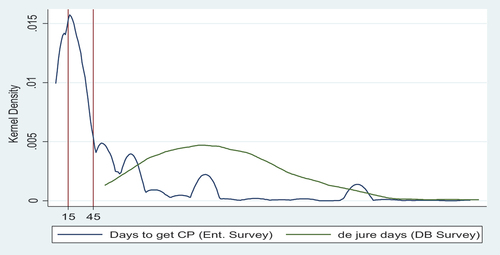
Figure 2. Countries are heterogeneous in deal making.
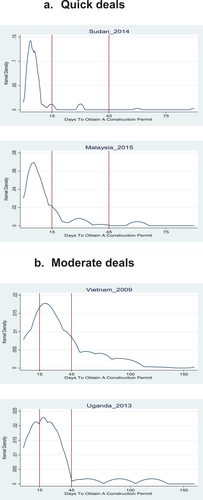
Figure 2. (Continued).
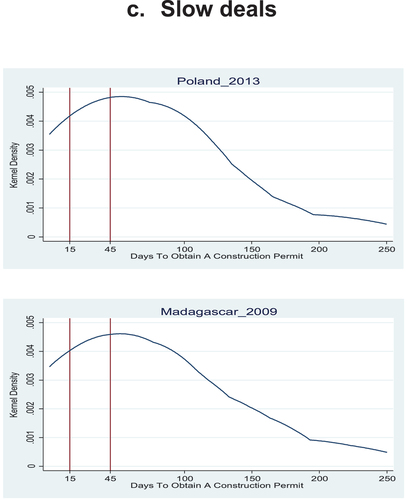
Figure 3. Relationship between Doing Business (construction permit) and state capability.
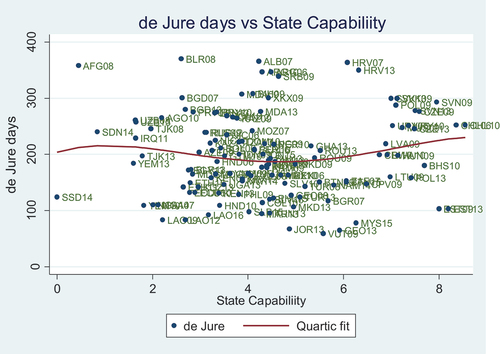
Figure 4. Relationship between quick deals and Doing Business (construction permit).
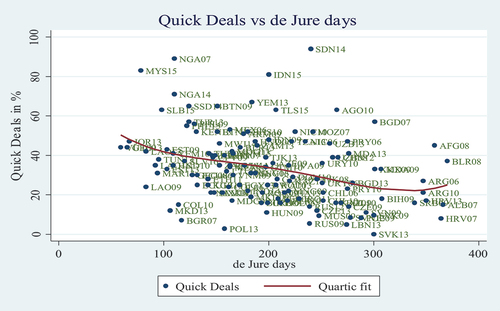
Figure 5. (a) Distribution of quick deals for Doing Business terciles. (b) Distribution of slow deals for Doing Business terciles
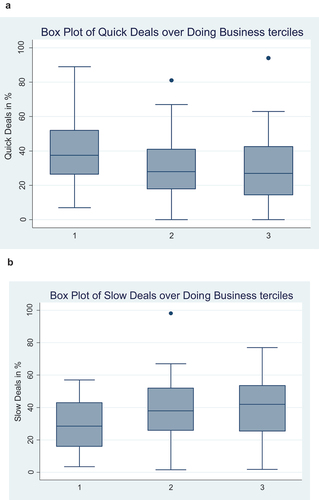
Figure 6. Relationship between quick deals and state capability.
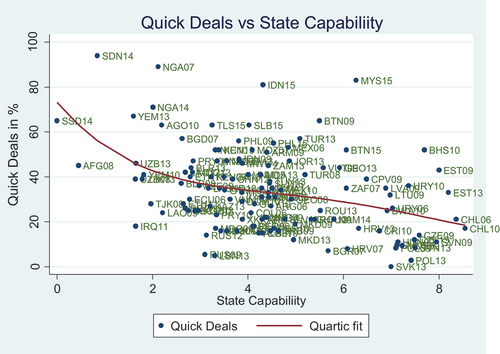
Table 1. Correlates of the percentage of quick deals (<15 days).
Table 2. Correlates of the percentage of moderate deals (15–45 days).
Table 3. Correlates of the percentage of slow deals (>45 days).
Table 4. Correlates of the percentage of quick deals (<15 days).
Table 5. Correlates of the percentage of moderate deals (15–45 days).
Table 6. Correlates of the percentage of slow deals (>45 days).
Figure 7. Increasing the De Jure regulation reduces quick deals for higher-capability states, but not for weak-capability states.
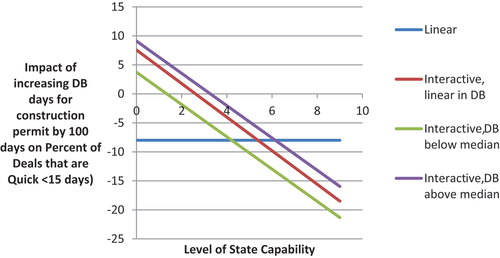
Figure 8. Increasing regulation increases the percentage of deals that are “slow” in strong capability countries, not in weak capability countries.
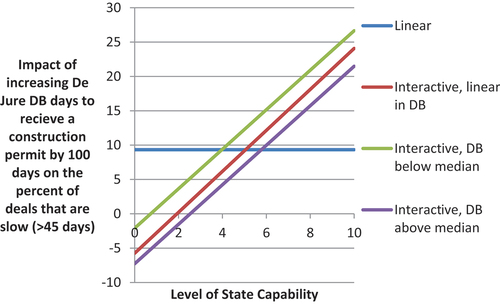
Figure 9. Policy diagnostic map for doing business.
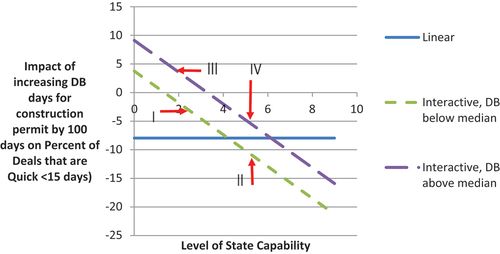
Table 7. Doing Business diagnostics.