
Figures & data
Figure 1. Overview of FTM (also known as RTT) protocol. The dashed lines show the control messages before the measurement took place.
Figure 2. Overview of WiFi-based fingerprinting for indoor positioning.
Figure 3. Overview of RTT-based trilateration in a two-dimensional space.
Table 1. The smartphones used in the experiments.
Figure 4. The settings of LoS, AP interference, body blockage scenarios.
Figure 5. The WiFi RSS data distribution under LoS, AP interference, body blockage and phone case blockage (only LG) scenarios. The smartphones were set 3 m away from the Google WiFi AP.
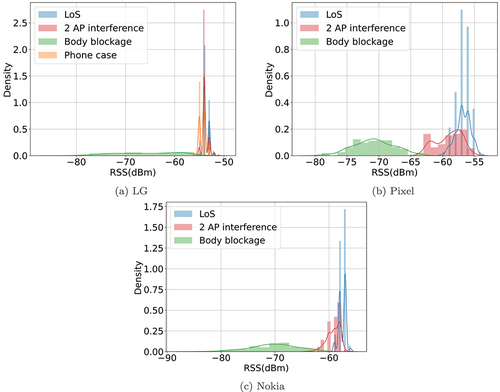
Figure 6. The comparison of RSS distribution under LoS, AP interference, body blockage and phone case blockage on three smartphones. Longer bar indicates signal instability.
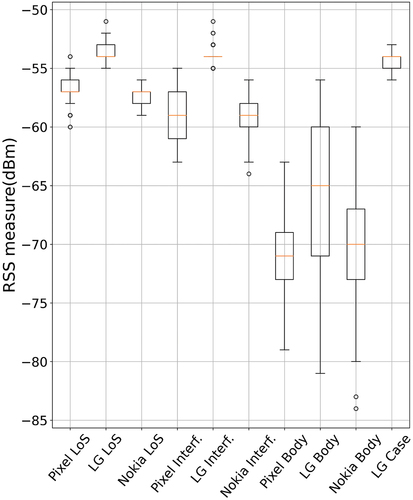
Figure 7. The raw WiFi RTT data distribution and CDF plot under LoS, AP interference, body blockage and phone case blockage (only LG) scenarios. The smartphones were set 3 metres away from the Google WiFi AP.
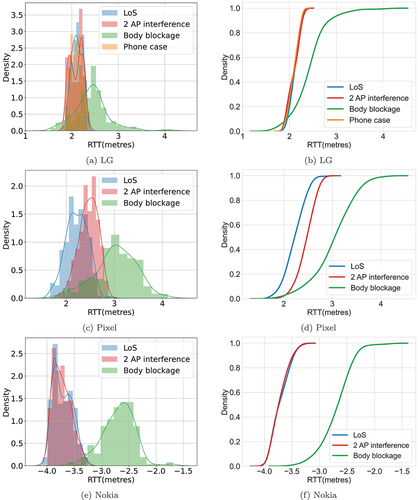
Figure 8. The comparison of RTT distribution under LoS, AP interference, body blockage and phone case blockage on three smartphones. Longer bar indicates signal instability.
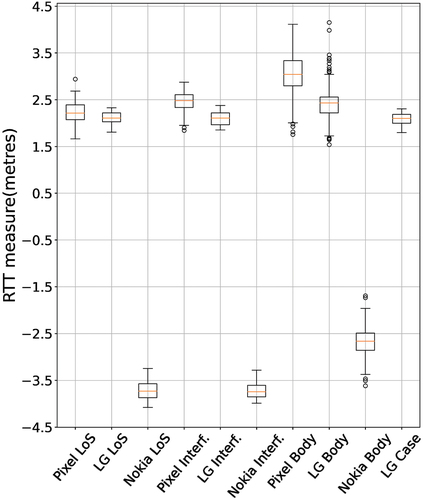
Figure 9. The WiFi RTT and RSS distributions with different gestures as described in . The smartphones were set 2 m away from the AP.
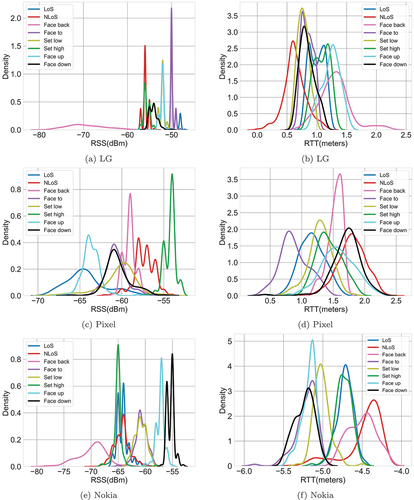
Table 2. The different placements of the smartphone.
Figure 10. The WiFi RTT distribution of the smartphone with different heading directions. The smartphone was set 2 m away and at the same height as the AP with its screen pointing to the ceiling. The orange dots indicate the average LoS RTT measures while the phone is in the LoS scenario.
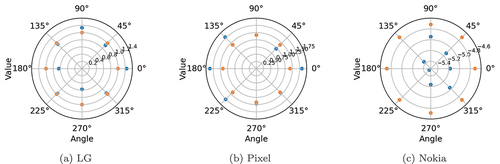
Figure 11. Overview of the ranging testbeds. The orange dots indicate the location of the AP. The grey area shows the experimental area.
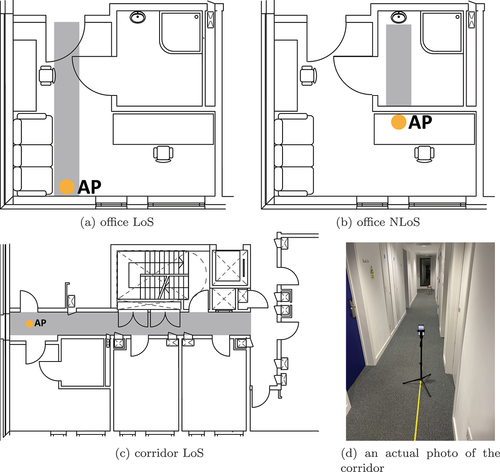
Figure 12. RTT measures as a function of the true distance and scaled RTT/RSS at different distances from the AP in office LoS scenario. The data was pre-processed, so all of its values are between 0 and 1. Boxplots of RSS measures are in red while those of RTT are in blue. The bigger the scaled RSS is, the weaker the signal is.
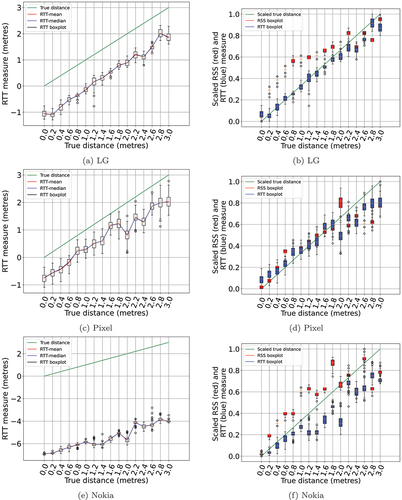
Figure 13. RTT measures as a function of the true distance and scaled RTT/RSS at different distances from the AP in office NLoS scenario. Boxplots of RSS measures are in red while those of RTT are in blue. The bigger the scaled RSS is, the weaker the signal is.
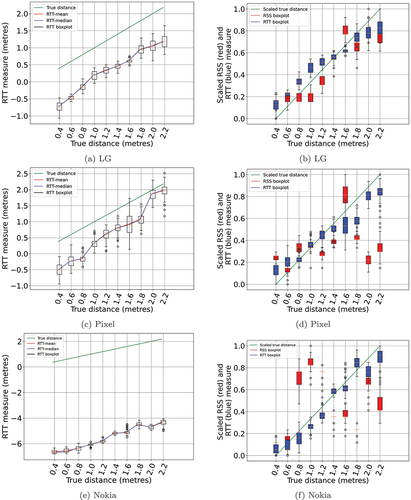
Figure 14. RTT measures as a function of the true distance and scaled RTT/RSS at different distances from the AP in corridor LoS scenario. Boxplots of RSS measures are in red while those of RTT are in blue. Note that the bigger the scaled RSS is, the weaker the signal is.
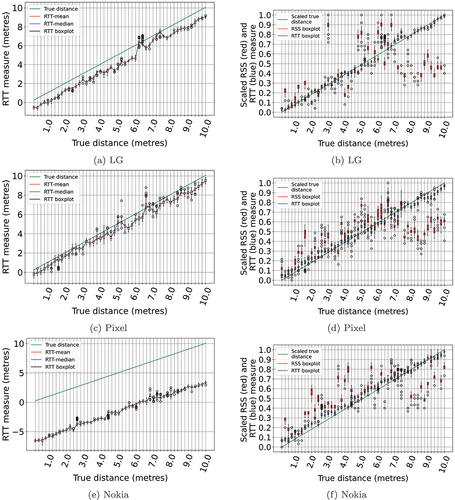
Figure 15. RTT measures as a function of the true distance and scaled RTT/RSS at different distances from the AP in vertical ranging experiment. Boxplots of RSS measures are in red while those of RTT are in blue. Note that the bigger the scaled RSS is, the weaker the signal is. For Nokia phone, the RTT measures barely changed when the phone was moved, leading to a barely visible boxplot.
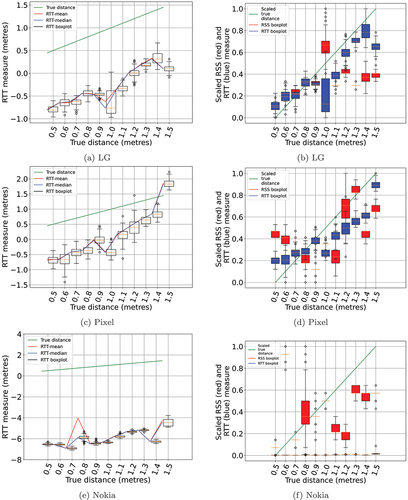
Table 3. Comparisons of RTT and RSS properties.
Figure 16. Layout of the three testbeds. The orange dots show the locations of the RTT-enabled APs. All measurements are taken in the grey areas.
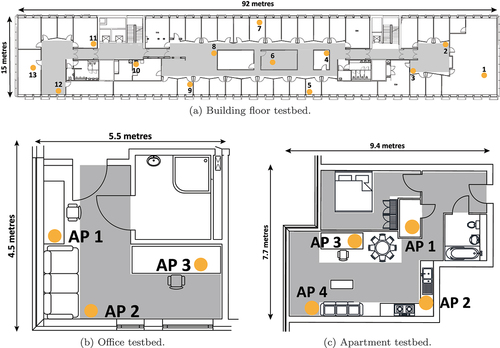
Table 4. The details of the proposed datasets.
Table 5. A Snapshot of the proposed WiFi dataset. The value −200 dBm in (a) and 100,000 millimetres (mm) in (b) indicate that the AP is not visible from the current reference point.
Figure 17. CDF of WiFi-based indoor positioning utilising ML with the building floor dataset. Note that in (a) and (b), the RTT+RSS line overlaps with the RTT line.
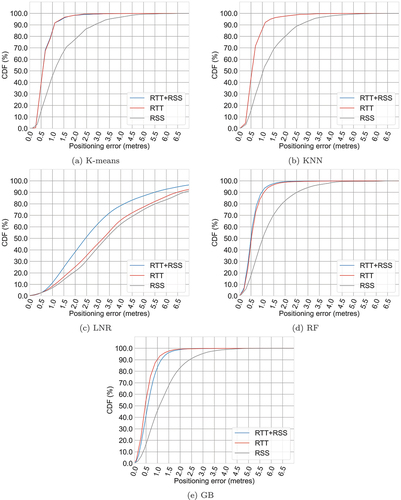
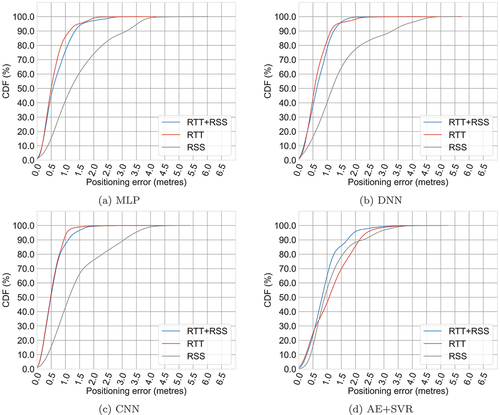
Figure 18. CDF of WiFi-based indoor positioning utilising ML with the office dataset. Note that in (a), (b), and (d), the RTT+RSS line overlaps the RTT line.
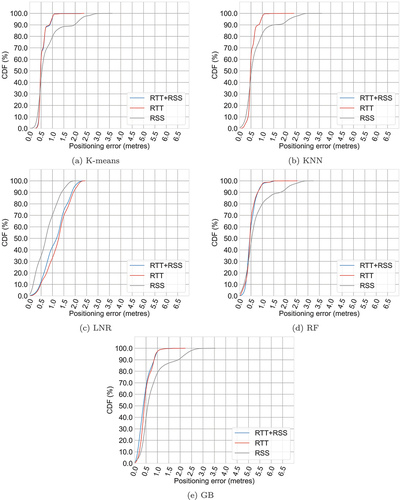
Figure 19. CDF of WiFi-based indoor positioning for utilising ML with the apartment dataset. Note that in (a), (b) and (d), the RTT+RSS line overlaps the RTT line.
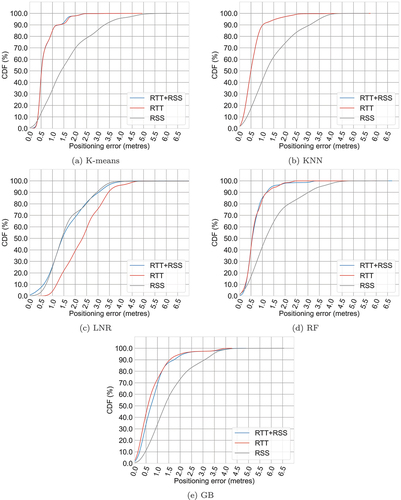
Table 6. RMSE results of WiFi-based indoor positioning utilising machine learning and deep learning in the building floor dataset. The terms mm and std indicate that the features are pre-processed with standard scaler (std) and min max scaler (mm), respectively.
Table 7. RMSE results of WiFi-based indoor positioning utilising machine learning and deep learning for the office room dataset. The terms mm and std indicate that the features are pre-processed with standard scaler (std) and min max scaler (mm), respectively.
Table 8. RMSE results of WiFi-based indoor positioning utilising machine learning and deep learning for the apartment dataset. The terms mm and std indicate that the features are pre-processed with standard scaler (std) and min max scaler (mm), respectively.
Figure 20. CDF of WiFi-based indoor positioning utilising deep learning with the building floor dataset. Note that in (a) and (b), the RTT+RSS line overlaps with the RTT line. And in (d), all lines overlap with each other.
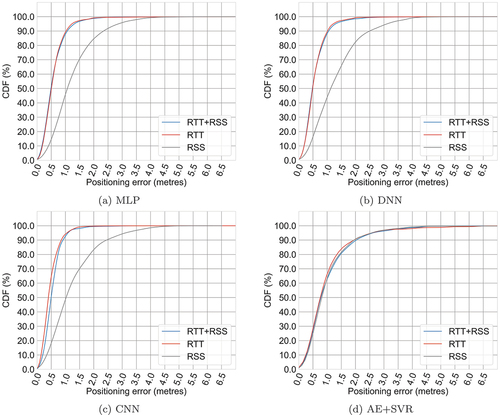
Figure 21. CDF of WiFi-based indoor positioning utilising deep learning for the office room dataset.
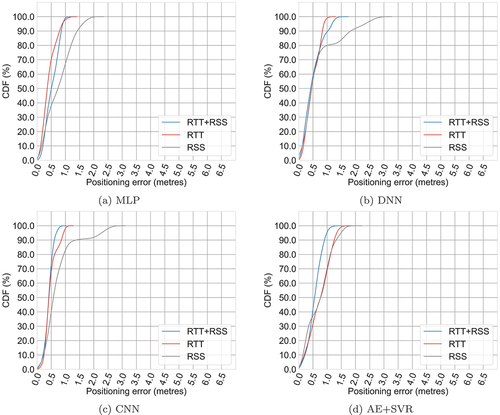
Figure 22. CDF of WiFi-based indoor positioning for utilising deep learning on the apartment dataset.
Data availability statement
The three datasets used in this paper are made publicly available here: https://github.com/Fx386483710/WiFi-RTT-RSS-dataset.