Figures & data
Figure 1. Re-analysis of the survival of the first fifty breast cancer patients operated upon by William S Halsted between 1889 and 1894 using the Kaplan–Meier method (solid line; source data in Halsted Citation1894). For comparison, we added the relative survival curve of US breast cancer patients in 2009 (dotted line; source: SEER 1975–2014 data by Howlader et al. Citation2017)
Figure 2. Web of Science® citation history of the Kaplan–Meier publication since 1958 as of November 2017, totalling 44,319 citations
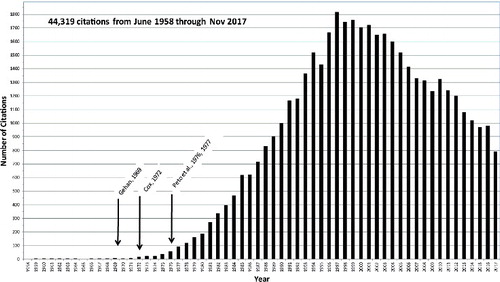
Figure 3. Survival after chemotherapy for solid tumours stratified by tumour response. This graph taken from the paper by Coltman et al. (Citation1971) from MD Anderson Cancer Center, with Edward Gehan as the biostatistician, is probably the first typical ‘staircase’ medical survival representation of Kaplan–Meier survival curves. (Reproduced with permission from Elsevier®)
Figure 4. Edward L Kaplan as a sophomore at Carnegie Institute of Technology at age 19 years. The photograph was taken on the occasion of the presentation of the Putnam prize to Kaplan in 1939 (see text) (Source with permission: Kaplan family archive)

Figure 5. Donald and Edward Kaplan on horseback, 1940 (Source with permission: Kaplan family archive)
Figure 6. Edward L Kaplan in 1981. (Source with permission: Oregon State University)