Figures & data
Figure 1. Probabilistic framework schematisation.
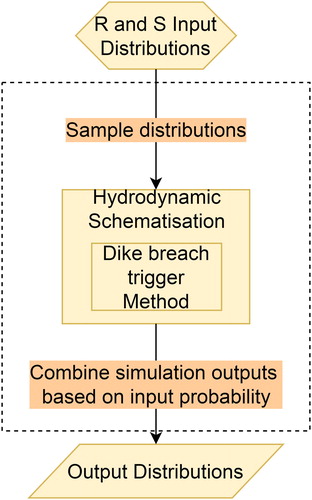
Figure 2. Top left map show case study location within the Netherlands. Indicated on larger map are the breach locations including the ones analysed in detail, as well as dike rings, river branches and the protection standards (failure probabilities of the embankment) associated with each dike trajectory.
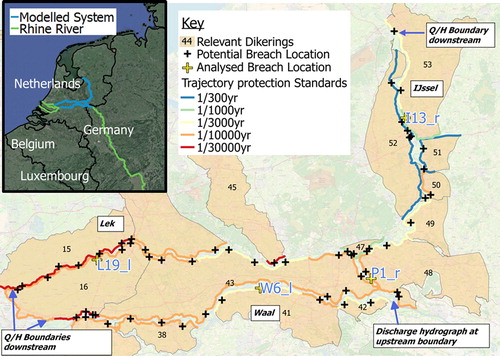
Figure 3. Example fragility surface for piping mechanism. Line in red shows original fragility curve, for which a duration of 48 h is considered most applicable by the experts. The cyan line shows the resulting threshold due to a sampling value of .7.
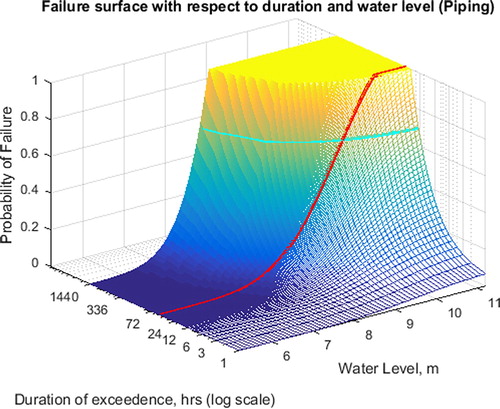
Table 1. Factors to adjust fragility curves for certain durations, as suggested by three different dike fragility experts, and overall averages.
Figure 4. Return period water levels for Scenarios 0, 1 and 2, at locations P1_r, W6_l, L19_1 and I13_l. These locations can be seen on a map in . Note that the x-axis scales are not the same per location. Scenarios 0, 1 and 2 represent no system behaviour, system behaviour dependent on water level and system behaviour dependent on water level and duration, respectively.
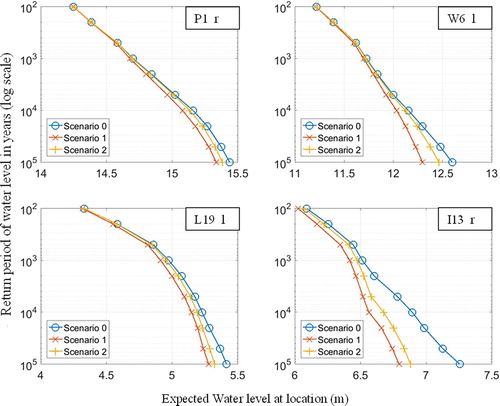
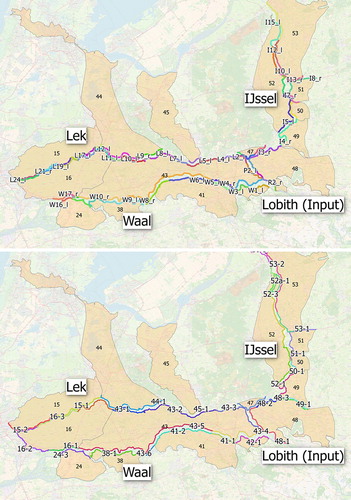
Figure 5. Relative change in failure probability of the overall trajectories when system behaviour is implemented, scenarios 1 (top) and 2 (bottom) Scenarios 1 and 2 represent system behaviour dependent on water level and system behaviour dependent on water level and duration, respectively.
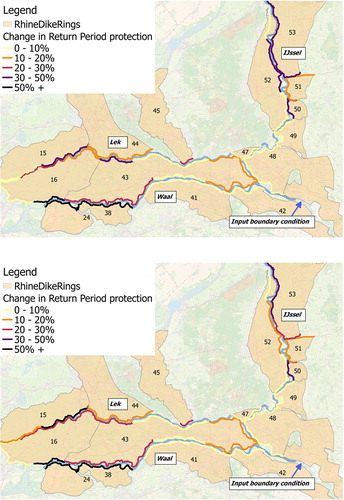
Table 2. Averaged breaching data for scenarios at selected location. Data relates to the 12,000 simulations performed for each scenario.
Figure 6. Expected breaches and breach volumes per return period event in the system.
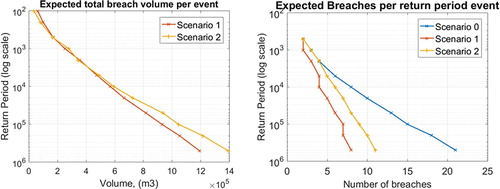
Figure 7. Return period discharges for Scenarios 0, 1 and 2, at locations P1_r, W6_l, L19_1 and I13_l. These locations can be seen on a map in . Note that the x-axis scales are not the same per location Scenarios 0, 1 and 2 represent no system behaviour, system behaviour dependent on water level and system behaviour dependent on water level and duration, respectively.
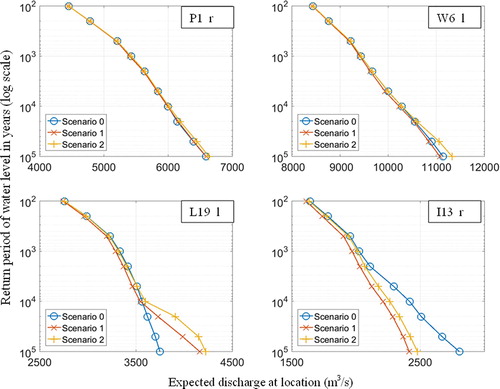
Figure A1. Breach locations used in the model and associated dike sections.