Figures & data
Figure 1. PINN illustration adapted from Lu et al. (Citation2019).
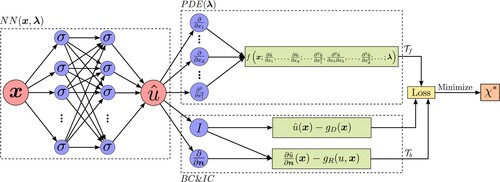
Figure 2. Solution of the Richards equation in terms of ψ.
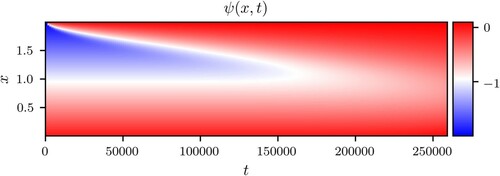
Figure 3. Solution of the Richards equation in terms of θ.
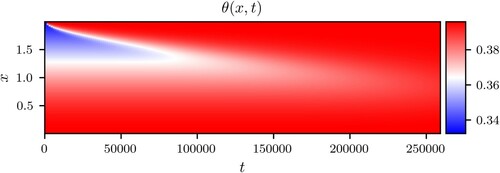
Figure 4. Inverse problem solution for the pressure head PINN formulation.

Table 1. Loss values with the estimates of input parameters for a range of values.
Figure 5. Inverse problem solution for the pressure head PINN formulation with noisy data and .
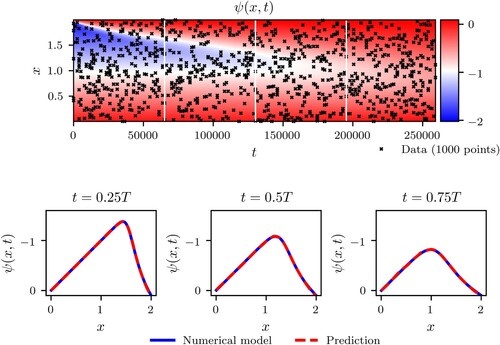
Table 2. Loss values with the estimates of input parameters for a range of values.
Figure 6. Inverse problem solution for the VWC-PINN formulation.
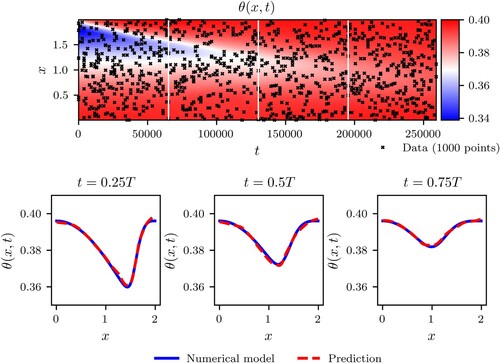
Table 3. Loss values with the estimates of input parameters for a range of values.
Figure 7. Inverse problem solution for the VWC-PINN formulation with a noisy data, specified with .
Table 4. Loss values with the estimates of input parameters for a range of values.
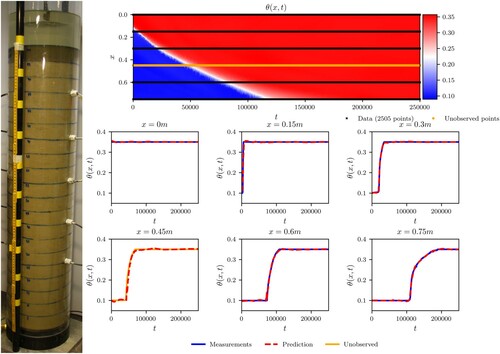
Figure 8. Water infiltration column setup with the PINN prediction of the solution and comparisons with the measurements.
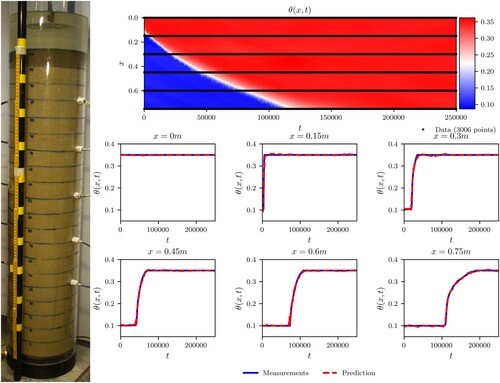
Figure 9. Water infiltration column setup with the PINN prediction of the solution and comparisons with the measurements and unobserved data.