Figures & data
Figure 1. Overview of how LLMs work, which can be decomposed into three steps: pro-processing, embedding, and decoding. The right path demonstrates how the input text is used to generate different downstream tasks, including text generation. The left path demonstrates how information from multimodal data is integrated into the LLMs in order to provide extra context to the downstream tasks. Note that the encoder in the embedding step is only an example. Some models, such as GPT-3, use a different type of embedding model.
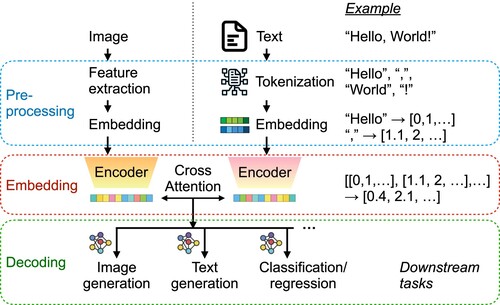
Figure 2. Three types of prompt engineering techniques to improve LLM performance from direct query (zero-shot): (1) Few-shot or in-context learning (ICL) refers to providing examples of question and answer (Q&A) pairs before inputting the actual query. (2) Chain of thought (CoT) refers to providing examples of the step-by-step logic used to solve the target query. (3) Tree of thought (ToT) refers to optimising the CoT prompts through a feedback loop from the LLMs' answers.
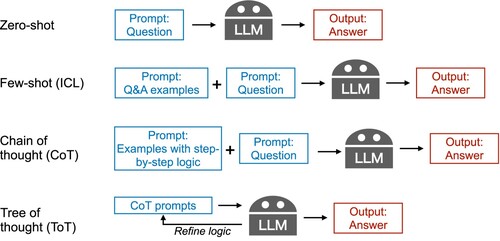
Figure 3. Overview of two important extensions to basic LLM use (gray path): (1) Fine-tuning (red path) refers to further training the LLM using a small set of data from a target task. (2) RAG (purple path) refers to a technique to link the LLM with external databases to help the LLM provide more accurate answers.
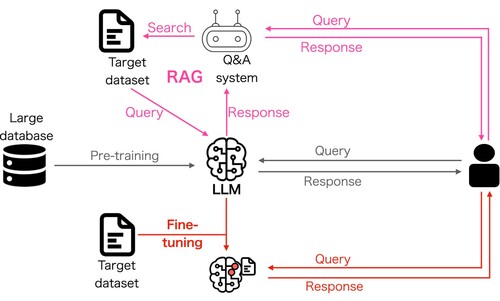
Figure 4. Overview of GPT uses in (a) the slope stability assessment study, (b) the microzoning by seismic risk study, (c) the simulation parameter recommendation study, and (d) the site similarity prediction study.
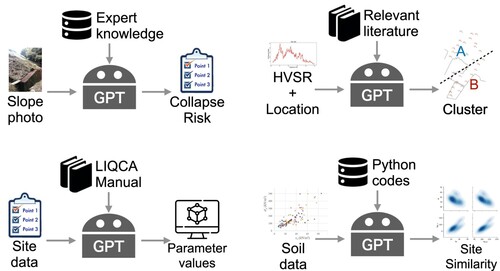
Table 1. Summary of the different aspects of the LLM framework considered in each case study.
Figure 5. Results of collapse probability prediction from GPT models. (a) Prediction performance of the zero-shot and few-shot GPT models based on the expert-assigned risk values for the six test photos. The error bars denote the standard deviation of the GPT predictions over three independent trials. (b) The first two principal components of the embedding vector for the photo descriptions generated by the few-shot GPT model. A total of 18 descriptions (3 trials of the 6 test photos) are plotted and the colours correspond to the predicted collapse probability.
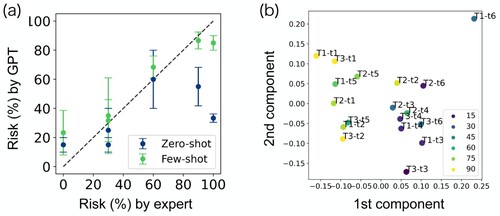
Figure 6. Results of microzoning predicted by the GPT model without domain knowledge based on HVSR curves at 10 selected sites from 4 location clusters. Four locations with a single outstanding peak below 2 Hz are grouped together (red) and the other six locations are grouped together (blue), which is a reasonable result without considering the spatial distance between the sites.
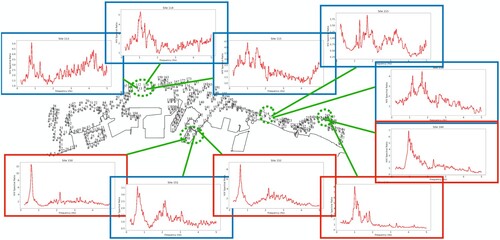
Figure 7. Results of microzoning predicted by the GPT model with domain knowledge based on HVSR curves at 10 selected sites from 4 location clusters. The result is almost the same as , except one of the blue site is now assigned to be red because the neighbouring sites are all grouped as red. This clustering result coincides perfectly with the experts' opinion.
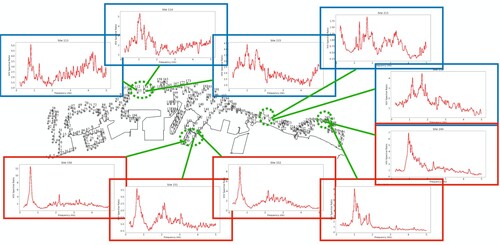
Figure 8. First two principal component space of the 13 dimensional parameter space of LIQCA. A generally understandable feature space was found, indicating stiffness, strength, and dilatancy level in three different directions. The different colours represent four soil categories grouped by geotechnical knowledge: (1) Cluster1 – experimental sand (loosely packed, Dr = 50%–70%) usually has a relatively high stiffness and dilatancy but strength is low. (2) Cluster2 – fill soil (reclaimed soil, such as in Port Island, Rokko Island, etc.) typically has a high stiffness but low dilatancy. (3) Cluster3 – natural deposit soil (relatively high fine particle content rate) has very diverse properties, scattering around the whole space. (4) Cluster4 – experimental sand (densely packed, Dr = 75%) usually has a distinctively high stiffness and strength.
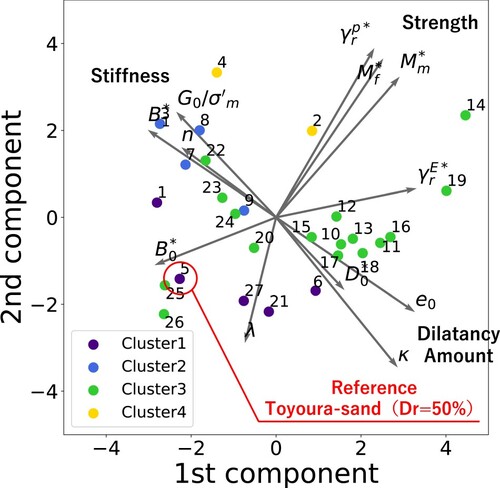
Figure 9. Recommeded parameter values by the GPT models projected to the same space as in . (a) Estimation of Toyoura-sand with varying relative densities, (b) Estimation of general soil types, including sand from Niigata and fill soil. It is evident that the GPT model primarily expresses the “difference in relative density” by adjusting parameters related to stiffness. The parameters for the sand from Niigata City, known for its homogeneous grain size, are estimated to be similar to those of Toyoura sand with a relative density (Dr) of 50%. The fill soil is differentiated from both Niigata sand and Toyoura sand mainly by altering the parameters associated with strength. See “chat_history.pdf” in SI for more details.
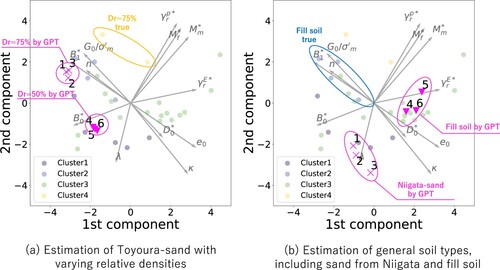
Figure 10. Results of the sensitivity analysis on linguistic information regarding relative density () and soil classification (fine fraction content). Figure (a) illustrates the shift in the parameter set as the relative density (
) gradually increases, starting from the parameters on the edges of the set at
50% (No. 1 parameter set in ). Figure (b) displays the shift in the parameter sets for “silty sand” and “clayey sand” from the approximate centre of the parameter set in Cluster 1 (experimental sand such as Toyoura sand with
50%).
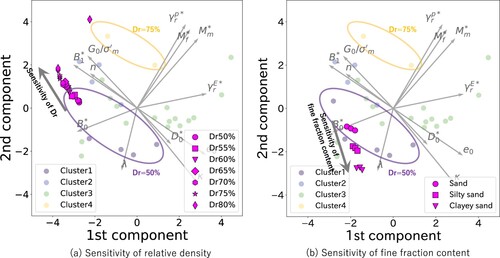
Figure 11. Result of similarity measure between the unknown target site and the 16 sites from the global database. The unknown site is supposed to be similar to site 13, which has the highest similarity value given by the GPT model.
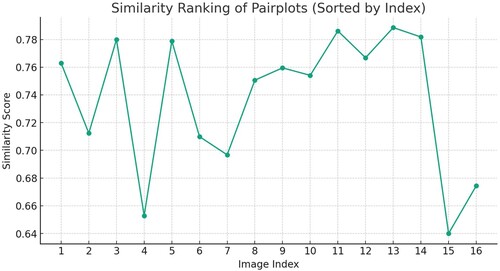
Table 2. Comparison of top 7 similarity ranking results.
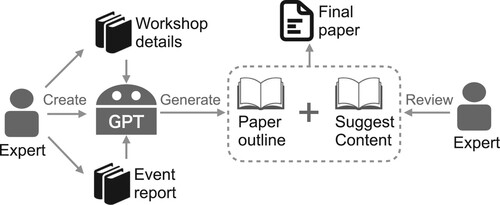
Figure 12. Workflow of the production of this paper. The authors are responsible for the production of the documents recording the workshop details and results of the studies conducted during the event, building the customised GPT model, and the final review and composition of the paper. The GPT model serves as a generator of writing idea, including the overall structure of the paper, paper title, and recommending corresponding content in each section of the paper.