
Figures & data
Figure 1. Example of a multimodal postcard of a pre-service teacher at the start of the TEP.

Table 1. Data Collection and Participants.
Table 2. Trainees’ (N = 51) visual representations in the postcards.
Figure 2. Postcard of a trainee.
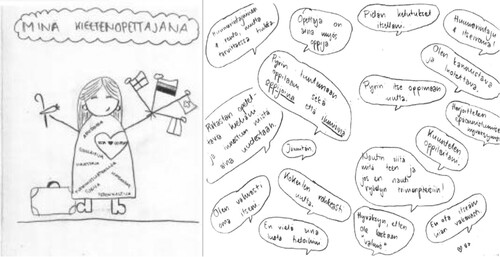
Figure 3. Postcard of a trainee.

Table 3. Distribution of the disorienting dilemmas mentioned by the pre-service teachers (N = 51) (the number of trainees who mentioned the topic presented in brackets, multiple mentioning possible).
Table 4. Distribution of the changes reported by the pre-service teachers (N = 43) (the number of the trainees who mentioned the topic presented in brackets, multiple mentioning possible).