
Figures & data
Table 1. Number of participants per profile group.
Figure 1. Screenshot of TranslationQ’s interface.
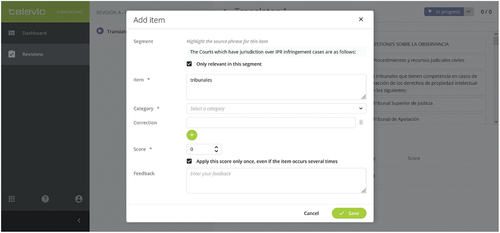
Figure 2. Average number of total, justified and missing corrections per profile group.
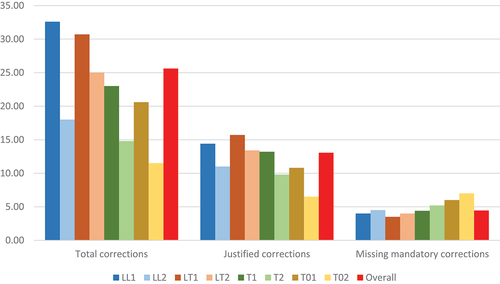
Table 2. Average correction scores per profile group.
Figure 3. Average number of total, justified and missing mandatory corrections per profile group and error group.
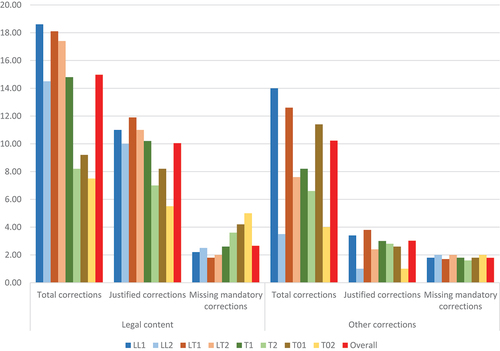
Table 3. Average correction scores per profile group and error group.
Table 4. Over-corrections and errors remaining in revised TT per profile group.
Table 5. Average time devoted to the revision task per profile group (in minutes).
Table 6. Revision scores and times for the best and worst revisions.
Figure 4. TT holistic assessment per profile group (average values).
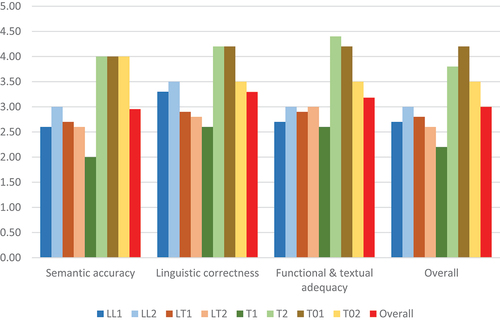
Table 7. TT holistic assessment per profile group (average values).
Table 8. Illustrative comments about the quality of the revised TT (our translations).
Table 9. Participants who considered that the TT was produced by an MT system (proportions per profile group).