Figures & data
Table 1. Real-time PCR primer synthesis list.
Figure 1. BMT Rag1−/− mice are established successfully. The ratio of CD3 + CD8+ T-cells was significantly increased in three randomly selected BMT Rag1−/− mice, indicating the successful establishment of BMT Rag1−/− mice.
BMT: Bone marrow transplant; Rag: Recombination activating gene.
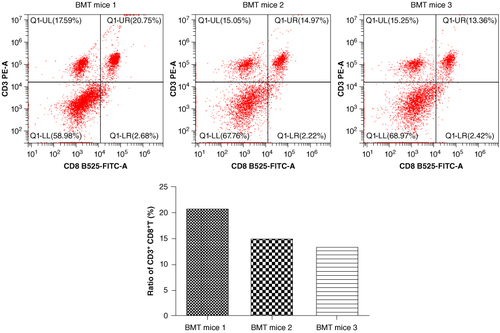
Figure 2. Anti-PD-1 therapy or naive CD8+ T-cells combination with anti-PD-1 therapy leads to severe SCI in BMT Rag1−/− mice, as assessed by BMS scores. Compared with the control group, the BMS score for SCI model group lowered significantly. By contrast to the mice in the SCI model group, BMS score of mice further reduced in the SCI exacerbation group, while was restored in the SCI treatment group.
*p < 0.05; ***p < 0.001.
BMT: Bone marrow transplant; BMS: Basso Mouse Scale for Locomotion; PD-1: Programmed death 1; Rag: Recombination activating gene; SCI: Spinal cord injury.
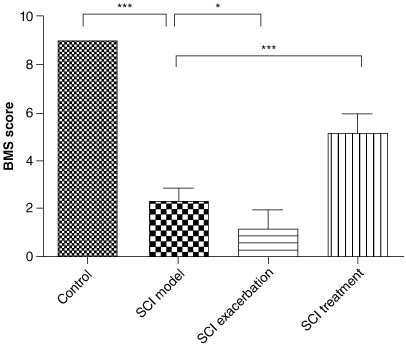
Figure 3. Successful establishment of SCI model via anti-PD-1 therapy. The pathological changes among the BMT Rag1−/− mice in the control (A), SCI model (B), SCI exacerbation (C) and SCI treatment (D) groups were observed via HE staining. WM represents white matter, GM represents gray matter, black arrow points to neurons and red arrow points to nerve fibers. Scale bar = 100 μm. Silver staining was conducted to further observe the structure of spinal cord in the control (E), SCI model (F), SCI exacerbation (G) and SCI treatment (H) groups. Scale bar = 100 μm. (I) Relative fluorescence intensity of CD3 or CD8 was calculated via immunofluorescence. Scale bar = 100 μm.
*p < 0.05; **p < 0.01; ***p < 0.001.
BMT: Bone marrow transplant; HE: Hematoxylin and eosin; PD-1: Programmed death 1; Rag: Recombination activating gene; SCI: Spinal cord injury.
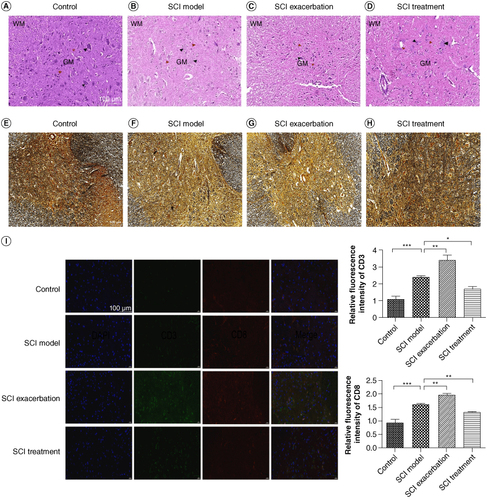
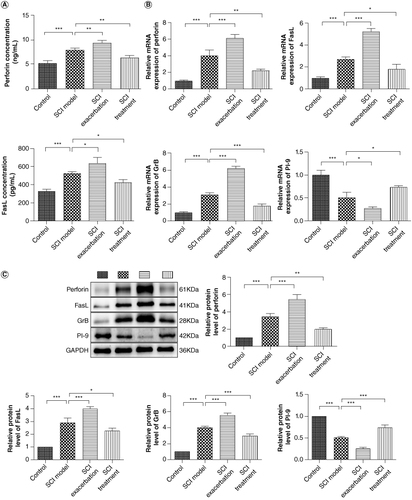
Figure 4. Anti-PD-1 therapy or naive CD8+ T-cells combination with anti-PD-1 therapy increases the levels of perforin, FasL and GrB, but decreases PI-9 level, while treatment with NSP reverses the expression of these factors. (A) The serum concentrations of perforin and FasL were measured by ELISA. (B) The mRNA expression of perforin, GrB, PI-9 and FasL was detected by qRT-PCR. (C) The protein levels of perforin, GrB, PI-9 and FasL were determined by western blotting.
*p < 0.05; **p < 0.01; ***p < 0.001.
FasL: Fas-ligand; GrB: Granzyme B; NSP: Neuroserpin; PD-1: Programmed death 1; PI-9: Proteinase inhibitor 9.