
Figures & data
Table 1. Study characteristics.
Figure 1. Quality assessment items and scores from the 18 included articles.
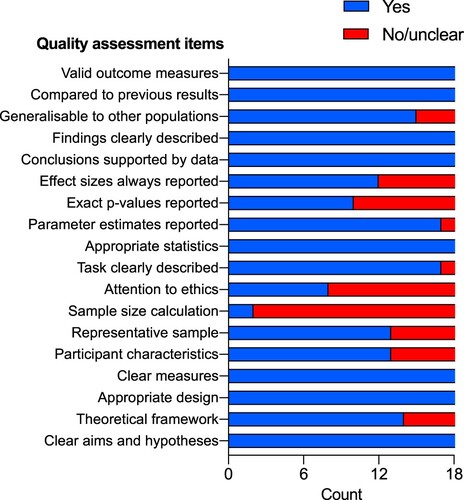
Figure 2. Scatter plots of the relationship between reported effect size and study quality (left) and sample size (right), with regression lines and 95% confidence intervals.
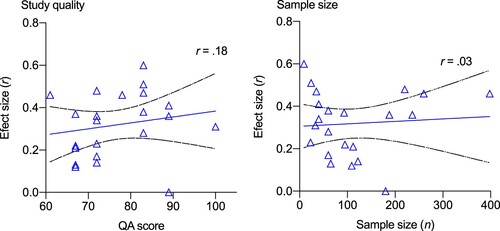
Figure 3. Funnel plots showing effect estimates (r) from individual studies against standard error. The outlying value in the left hand panel (bottom right) represents the study of Cowley et al. (Citation2019) which had a small sample size. The right-hand panel illustrates the funnel plot with this outlier removed. The effect sizes and precisions illustrated by the remaining data points cluster within the funnel but are sparser to the lower left-hand corner, suggesting a possible publication bias away from studies with smaller effects and smaller samples.
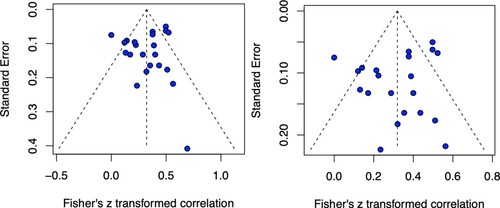
Figure 4. Forest plot of effect sizes (r) from all studies included in the systematic review. The combined estimate and 95% confidence interval (blue diamond) indicates a reliable moderate-sized relationship between flow and performance. The size of the light blue squares indicates the weight of the study in the combined analysis (based on sample size). The plot also shows the prediction interval (PI; thick black line), the range within which the point estimate of 95% of all future studies are likely to fall.
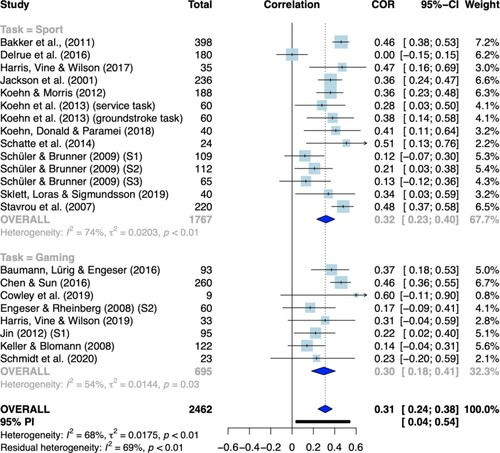
Figure 5. GOSH plots illustrating the results of the combinatorial meta-analyses in the form of a scatter plot of effect size estimates against heterogeneity for all possible combinations. The plot show results for all included studies (Left), and with (red) and without (blue) the potential outlier studies of Bakker et al. (Citation2011) (Center) and Delrue et al. (Citation2016) (Right). The marginal distributions indicate that these two studies introduce some heterogeneity (particularly Delrue et al.) but do not bias the overall effect estimate.
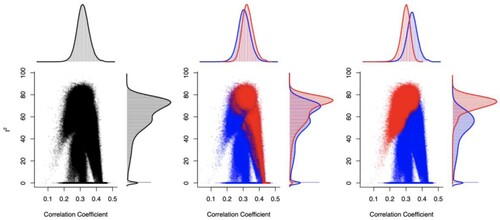
Table 2. Results of the leave-one-out analysis.
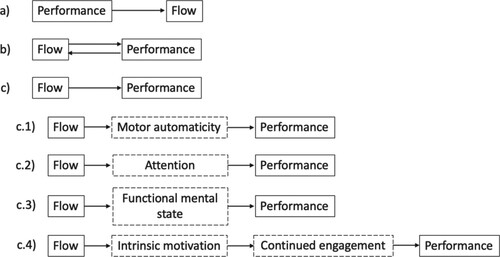
Figure 6. Schematic diagram of the flow–performance relationships and proposed mechanisms arising from the systematic review. No studies focused directly on relationship a or b but both were acknowledged as possible relationships (Jin, Citation2012; Schattke et al., Citation2014). Relationship c was the most common and discussed explicitly in at least 11 articles. Of the articles describing relationship c, a number of specific pathways were outlined: c.1 was proposed in Koehn et al. (Citation2013); c.2 was proposed in two studies by Harris et al. (Citation2017c, Citation2019); c.3 was proposed in Engeser and Rheinberg (Citation2008) and Sklett et al. (Citation2018), and c.4 was proposed in the studies of Schüler and Brunner (Citation2009). In relation to the two routes for performance enhancement proposed by Landhäußer and Keller (Citation2012), c.1, c.2, and c.3 relate to the direct route, and c.4 relates to the indirect effect of motivation.
Data availability
All relevant data and code is available online from https://osf.io/3hfcu/