
Figures & data
Figure 1. PRISMA (Preferred Reporting Items for Systematic Reviews and Meta-Analysis) chart of search strategy.
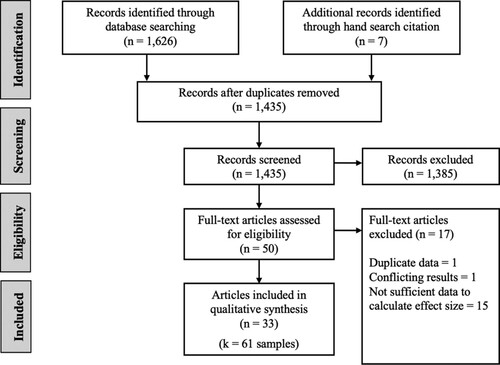
Table 1. Summary of included studies.
Figure 2. Summary forest plots for the pre–post data (a), low-pressure experimental data (b), and experimental data under pressure (c). The thickness of the grey confidence intervals is proportional to the number of effect sizes reported within studies (J).
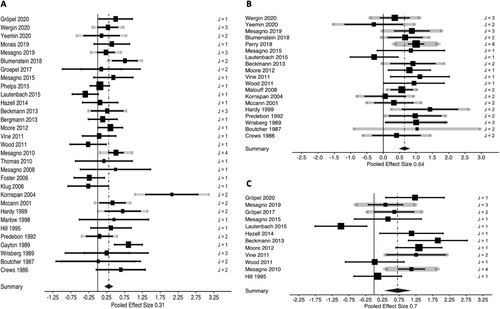
Table 2. Model results.
Table 3. Results of meta-regressions.
Table 4. Results of subgroup analyses.
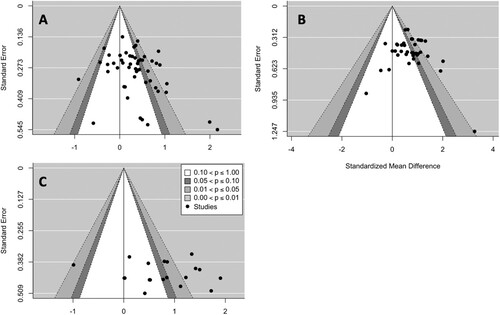
Figure 3. Funnel plots for the pre–post data (a), low-pressure experimental data (b), and experimental data under pressure (c).
Supplemental material
Supplemental Material
Download MS Word (30.8 KB)Data availability statement
The meta-analysis data can be found at https://doi.org/10.6084/m9.figshare.14077091
. The meta-analysis code and Supplementary Tables S1 and S2 can be found at https://doi.org/10.6084/m9.figshare.14076065 .