
Figures & data
Figure 1. Schematic structure of caplacizumab. aa: amino acids; Da: Dalton; MW: molecular weight; vWF: von Willebrand factor.
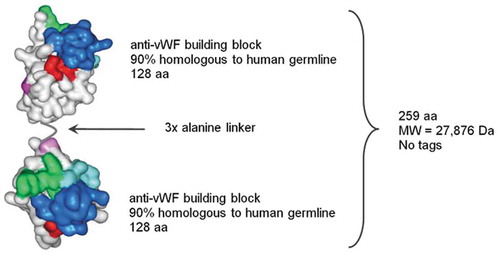
Figure 2. Mechanism of action of caplacizumab in aTTP [Citation28]. Reprinted from transfus apher sci, volume 46, Holz JB, The TITAN trial–assessing the efficacy and safety of an anti-von Willebrand factor Nanobody in patients with acquired thrombotic thrombocytopenic purpura, pages 343–346, Copyright (2012), with permission from Elsevier.
![Figure 2. Mechanism of action of caplacizumab in aTTP [Citation28]. Reprinted from transfus apher sci, volume 46, Holz JB, The TITAN trial–assessing the efficacy and safety of an anti-von Willebrand factor Nanobody in patients with acquired thrombotic thrombocytopenic purpura, pages 343–346, Copyright (2012), with permission from Elsevier.](/cms/asset/b90c2d65-2ac5-442e-bf02-d199da3e3d58/ierj_a_1607293_f0002_oc.jpg)
Figure 3. Mean vWF:Ag levels vs time profiles during a 7 days repeated subcutaneous 10 mg daily dosing of caplacizumab in healthy volunteers (a) [Citation31], and during repeated subcutaneous daily administration of 10 mg caplacizumab in aTTP patients (b) [Citation33,Citation34]. aTTP: acquired thrombotic thrombocytopenic purpura; PE: plasma exchange; FU: follow-up; vWF: von Willebrand factor.
![Figure 3. Mean vWF:Ag levels vs time profiles during a 7 days repeated subcutaneous 10 mg daily dosing of caplacizumab in healthy volunteers (a) [Citation31], and during repeated subcutaneous daily administration of 10 mg caplacizumab in aTTP patients (b) [Citation33,Citation34]. aTTP: acquired thrombotic thrombocytopenic purpura; PE: plasma exchange; FU: follow-up; vWF: von Willebrand factor.](/cms/asset/714a22da-4003-4ca2-833c-4ecdff125218/ierj_a_1607293_f0003_oc.jpg)
Figure 4. Mean (± SD) RICO activity in the phase II (left panel) [Citation32] and the phase III (right panel) [Citation33]. RICO values of <20% represent the threshold for pharmacological activity of caplacizumab. Graphs show mean ± standard error of the mean. PE: plasma exchange; FU: follow-up; RICO: ristocetin cofactor; SD: standard deviation; vWF: von Willebrand factor.
![Figure 4. Mean (± SD) RICO activity in the phase II (left panel) [Citation32] and the phase III (right panel) [Citation33]. RICO values of <20% represent the threshold for pharmacological activity of caplacizumab. Graphs show mean ± standard error of the mean. PE: plasma exchange; FU: follow-up; RICO: ristocetin cofactor; SD: standard deviation; vWF: von Willebrand factor.](/cms/asset/8f57d2e2-b56a-49a9-b5bb-e87291843468/ierj_a_1607293_f0004_oc.jpg)
Figure 5. Caplacizumab plasma concentration versus time profile after administration of single ascending subcutaneous doses (a), and after single (Day 1 solid line) and repeated (Day 7 dotted line) administration of 10 mg daily subcutaneous doses for seven days (b) in healthy volunteers [Citation31]. sc: subcutaneous.
![Figure 5. Caplacizumab plasma concentration versus time profile after administration of single ascending subcutaneous doses (a), and after single (Day 1 solid line) and repeated (Day 7 dotted line) administration of 10 mg daily subcutaneous doses for seven days (b) in healthy volunteers [Citation31]. sc: subcutaneous.](/cms/asset/d079ce84-0e94-4ad5-bef8-8f6e6439f171/ierj_a_1607293_f0005_oc.jpg)
Table 1. Pharmacokinetic parameters following single 10 mg intravenous or subcutaneous administration of caplacizumab in healthy volunteers.
Table 2. Simulated mean steady-state pharmacokinetic exposure parameters (AUC, Cmax, Cmin, and Cavg) and corresponding pharmacodynamic effect (vWF:Ag change from baseline) following 40 days of 10 mg subcutaneous daily administration of caplacizumab in aTTP patients.
Table 3. Simulated median steady-state pharmacokinetic exposure parameters (AUC, Cmax, Cmin) and corresponding pharmacodynamic effect (vWF:Ag change from baseline) following 40 days of 10 mg subcutaneous daily administration of caplacizumab in aTTP patients with low bodyweight, high baseline vWF levels, and low CrCL.
Table 4. Efficacy endpoints by pharmacokinetic quartile at the end of Plasma Exchange and end of the study drug (caplacizumab) treatment period in aTTP patients from the phase II and III studies.
Table 5. Percentage of patients reporting adverse events by body system and preferred term at end of Plasma Exchange and end of study drug (caplacizumab) treatment by quartile of exposure from the phase II and III studies in aTTP patients.