Figures & data
Figure 1. Mean steady-state serum (a) progesterone (P4) and (b) estradiol (E2) concentrations following daily oral administration of 1 mg E2/100 mg P4 (no baseline adjustment) at day 7.
Table 1. Main inclusion and exclusion criteria in the REPLENISH study.
Figure 2. Subject disposition in the REPLENISH trial.
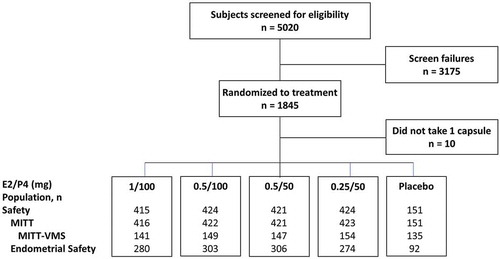
Table 2. Participant demographics and baseline characteristics of the modified intent-to-treat (MITT)-VMS population.
Figure 3. Weekly reduction in VMS (a) frequency and (b) severity in MITT-VMS population. For (a) p < 0.05 versus placebo from *weeks 3–12; †weeks 4–12; ‡weeks 6–12; for (b) p < 0.05 versus placebo from *weeks 3–12; †weeks 7, 9–12; ‡weeks 6, 7, 9. Weekly severity score = [(number of mild hot flushes for 7 days) x 1 + (number of moderate hot flushes for 7 days) x 2 + (number of severe hot flushes for 7 days) x 3]/(total number of mild, moderate and severe hot flushes over 7 days). E2: 17β-estradiol; MITT: modified intent-to-treat; P4: progesterone; VMS: vasomotor symptoms. Reprinted with permission from Lobo et al [Citation30].
![Figure 3. Weekly reduction in VMS (a) frequency and (b) severity in MITT-VMS population. For (a) p < 0.05 versus placebo from *weeks 3–12; †weeks 4–12; ‡weeks 6–12; for (b) p < 0.05 versus placebo from *weeks 3–12; †weeks 7, 9–12; ‡weeks 6, 7, 9. Weekly severity score = [(number of mild hot flushes for 7 days) x 1 + (number of moderate hot flushes for 7 days) x 2 + (number of severe hot flushes for 7 days) x 3]/(total number of mild, moderate and severe hot flushes over 7 days). E2: 17β-estradiol; MITT: modified intent-to-treat; P4: progesterone; VMS: vasomotor symptoms. Reprinted with permission from Lobo et al [Citation30].](/cms/asset/ebd68eba-5c26-48b8-ab84-cdaea1876dc1/ierj_a_1637731_f0003_oc.jpg)
Figure 4. Mean reduction from baseline in Menopause-specific Quality of Life (MENQOL) (a) overall and (b) vasomotor domain scores in MITT-VMS population and in Medical Outcome Study (MOS)-Sleep (c) total and (d) Sleep Problems Index I scores in MITT population. *p < 0.05; †p < 0.01; ‡p < 0.001 vs placebo. Sleep Problems Index I based on the following questions: How often during the past 4 weeks did you: Get enough sleep to feel rested upon waking; Awaken short of breath or with a headache; Have trouble falling asleep; Awaken and have trouble falling asleep again; Have trouble staying awake during the day; Get the amount of sleep you needed? E2, 17β-estradiol; MITT, modified intent-to-treat; P4, progesterone; VMS: vasomotor symptoms. Figure 4(a,b) adapted with permission from Simon et al [Citation36] Figure 4(c,d) adapted with permission from Kagan et al [Citation37].
![Figure 4. Mean reduction from baseline in Menopause-specific Quality of Life (MENQOL) (a) overall and (b) vasomotor domain scores in MITT-VMS population and in Medical Outcome Study (MOS)-Sleep (c) total and (d) Sleep Problems Index I scores in MITT population. *p < 0.05; †p < 0.01; ‡p < 0.001 vs placebo. Sleep Problems Index I based on the following questions: How often during the past 4 weeks did you: Get enough sleep to feel rested upon waking; Awaken short of breath or with a headache; Have trouble falling asleep; Awaken and have trouble falling asleep again; Have trouble staying awake during the day; Get the amount of sleep you needed? E2, 17β-estradiol; MITT, modified intent-to-treat; P4, progesterone; VMS: vasomotor symptoms. Figure 4(a,b) adapted with permission from Simon et al [Citation36] Figure 4(c,d) adapted with permission from Kagan et al [Citation37].](/cms/asset/bcc83a26-7cc5-42a7-84a7-24146c504b44/ierj_a_1637731_f0004_oc.jpg)
Table 3. Treatment-related TEAEs occurring in ≥3% in any treatment arm and more commonly than placebo and treatment-related serious AEs (safety population).
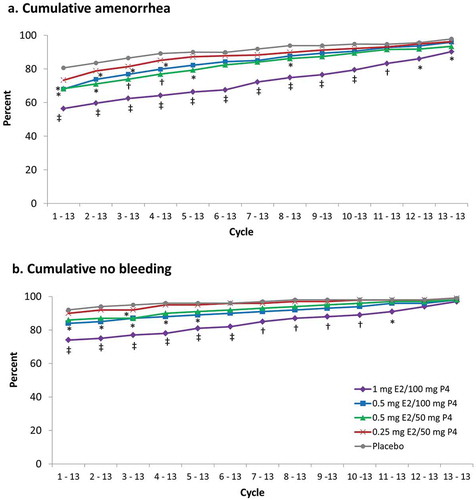
Figure 5. Cumulative (a) amenorrhea and (b) no bleeding in safety population. *p < 0.05; †p ≤ 0.01; ‡p < 0.001 vs placebo. Cycles are 28 days in length. E2, 17β-estradiol; P4, progesterone.