
Figures & data
Table 1. Baseline patient demographics
Table 2. Summary of ECG measurements
Figure 1. Relationship between glasdegib plasma concentration and (a) RR, (b) QTcF, and (c) QTcS intervals
The relationship between RR, QTcF, and QTcS with glasdegib plasma concentration is presented along with the best fit line for each measurement using a linear mixed-effects model. The CIs are provided for the glasdegib plasma concentration slope parameter in each model. The points are colored based on the study from which they were collected.CI, confidence interval; QT, interval length between the Q and T waves; QTc, QT interval corrected for heart rate; QTcF, QT interval corrected for heart rate using Fridericia’s formula; QTcS, QT interval corrected for heart rate using a population-specific formula; RR, interval length between successive R waves
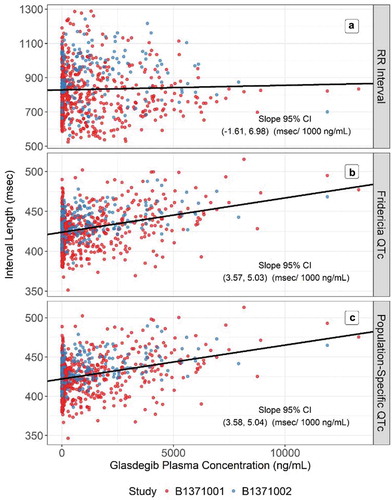
Figure 2. Assessment of the correction factors for QT interval: QTcB, QTcF, and QTcS
The best fit line using a linear mixed-effects model is provided along with the CI for the slope of the RR effect. If the CI does not include 0, it indicates that the relationship with RR has not been sufficiently corrected.CI, confidence interval; QT, interval length between the Q and T waves; QTc, QT interval corrected for heart rate; QTcB, QT interval corrected for heart rate using Bazett’s formula; QTcF, QT interval corrected for heart rate using Fridericia’s formula; QTcS, QT interval corrected for heart rate using a population-specific formula; RR, interval length between successive R waves
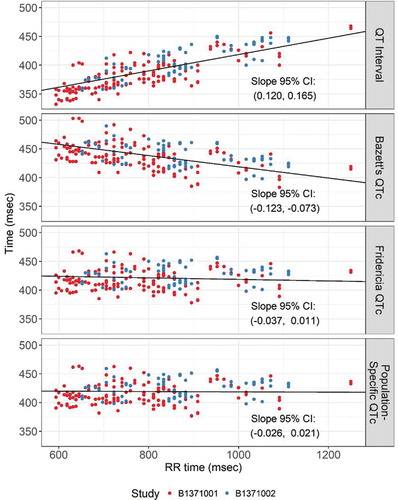
Table 3. Final E-R models for QTcF and QTcS
Table 4. Median and 95% CI for the mean change in QTc at therapeutic and supratherapeutic exposures
Supplemental material