
Figures & data
Table 1. Approved dose regimens and key clinical pharmacology properties of zanubrutinib relative to those of ibrutinib and acalabrutinib
Figure 1. Chemical structure of zanubrutinib
Table 2. Kinase selectivity of zanubrutinib, ibrutinib, and acalabrutinib
Figure 2. Plasma concentration-time profile of zanubrutinib after single dosing. Error bars indicate standard deviation [Citation27]
![Figure 2. Plasma concentration-time profile of zanubrutinib after single dosing. Error bars indicate standard deviation [Citation27]](/cms/asset/a3406f84-4046-476b-bd9b-490bb1ee5de5/ierj_a_1978288_f0002_oc.jpg)
Figure 3. Free drug concentration time profiles relative to IC50 of approved BTK inhibitors
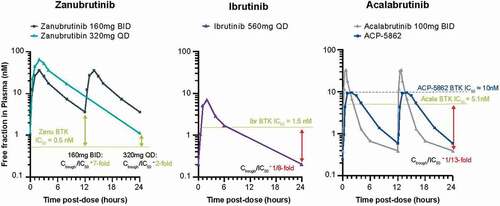
Figure 4. (A) Zanubrutinib BTK occupancy in peripheral blood mononuclear cells by dose regimen. (B) Zanubrutinib BTK occupancy in lymph nodes by dose regimen. Median values are shown as lines through the individual symbols. BID twice a day, BTK Bruton’s tyrosine kinase, N number of patients, QD once a day, W1D1 Week 1 Day 1, W1D3, Week 1 Day 3, W2D1 Week 2 Day 1 [Citation11]. Predose samples were collected 24 hours after dosing for the QD dose or 12 hr after dosing for the BID dose. Samples were collected 4 hours after dose for ‘W1D1 4 hours’ samples. Republished in part with permission of Elsevier Science & Technology Journals, from Tam CSL, Trotman J, Opat S, et al. Phase 1 study of selective BTK inhibitor zanubrutinib in B-cell malignancies and safety and efficacy evaluation in CLL. Blood. 2019;134(11):851–859; permission conveyed through Copyright Clearance Center, Inc
![Figure 4. (A) Zanubrutinib BTK occupancy in peripheral blood mononuclear cells by dose regimen. (B) Zanubrutinib BTK occupancy in lymph nodes by dose regimen. Median values are shown as lines through the individual symbols. BID twice a day, BTK Bruton’s tyrosine kinase, N number of patients, QD once a day, W1D1 Week 1 Day 1, W1D3, Week 1 Day 3, W2D1 Week 2 Day 1 [Citation11]. Predose samples were collected 24 hours after dosing for the QD dose or 12 hr after dosing for the BID dose. Samples were collected 4 hours after dose for ‘W1D1 4 hours’ samples. Republished in part with permission of Elsevier Science & Technology Journals, from Tam CSL, Trotman J, Opat S, et al. Phase 1 study of selective BTK inhibitor zanubrutinib in B-cell malignancies and safety and efficacy evaluation in CLL. Blood. 2019;134(11):851–859; permission conveyed through Copyright Clearance Center, Inc](/cms/asset/84bb768a-be89-4b02-96f7-06a0891be48b/ierj_a_1978288_f0004_oc.jpg)
Table 3. Comparison of extrinsic and intrinsic factors impacting zanubrutinib, ibrutinib, and acalabrutinib
Table 4. Comparison of response rates between two dose regimens of zanubrutinib in patients with B-cell malignancies in study BGB-3111-AU-003